UPFINA's Mission: The pursuit of truth in finance and economics to form an unbiased view of current events in order to understand human action, its causes and effects. Read about us and our mission here.
Reading Time: 5 minutes
Over the long term markets take money from those with lazy/poor analysis and give it to those who do rigorous analysis and stick with it. In the past few years, there have been some prognosticators who claimed the economy was ‘due for a recession’ because there usually is one about every 6 years. That’s a lazy perspective to have because most expansions have been shorter or longer than the average. As you can see in the chart below, few of the lines end near the average length. Rigorous analysis tells you that business cycles don’t have a static time clock they must obey. There are dynamic effects that cause cycles to vary in length.
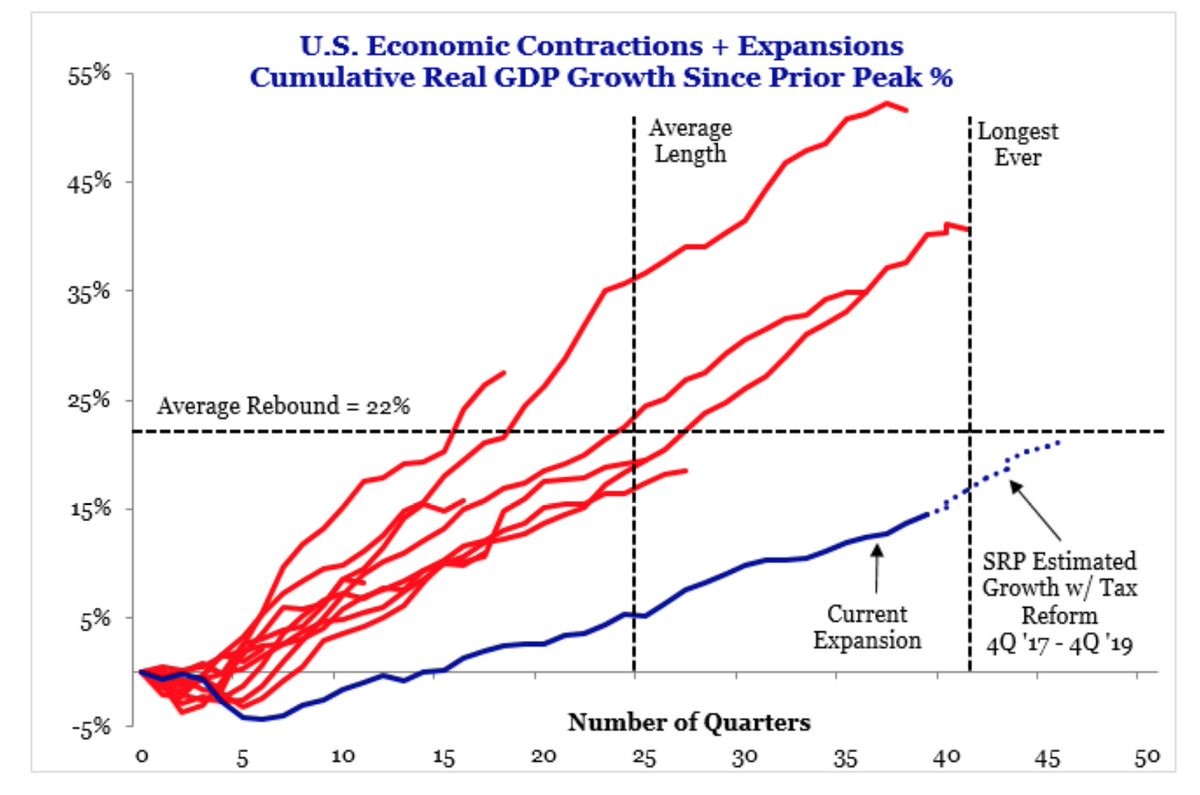
It Has Been A Long Weak Expansion
The chart depicts the current cycle as the blue line. A quick look at the cycle shows the total growth hasn’t even reached the size of the average cycle even though it’s the 3rd longest since 1854. Instead of growing fast enough to pick up inflation which leads to a recession, growth has been so low that deflation has been a greater force on the economy. Even with the boost from tax cuts, this expansion will be the longest one before it gets to the average total growth. Regardless of length and total growth, the variable to watch in 2018 is how much growth accelerates and if it causes inflation. That will put the economy in a truly late cycle state. That’s a noteworthy point because many analysts have been claiming the economy is late-cycle just because the expansion is old. A good analogy for this is the difference between a 70 year old man who can barley walk and one who runs a 5K every week. Age isn’t a great depicter for how healthy someone is and the age of the business cycle isn’t a great help to figuring out which stage it’s in.
2-3 Years Until Next Recession?
Since the averages don’t tell us much about when the next recession will come, what does? The best way to time future recessions is by looking at the economy from the top down to compare various metrics to previous cycles. One indicator is the output gap. The chart below shows the yield curve, which is another indicator. The yield curve has been tracking the average of prior cycles very closely in the past 2 years. If the Fed follows along with its guidance of raising rates 75 basis points in 2018, it will likely flatten the yield curve.
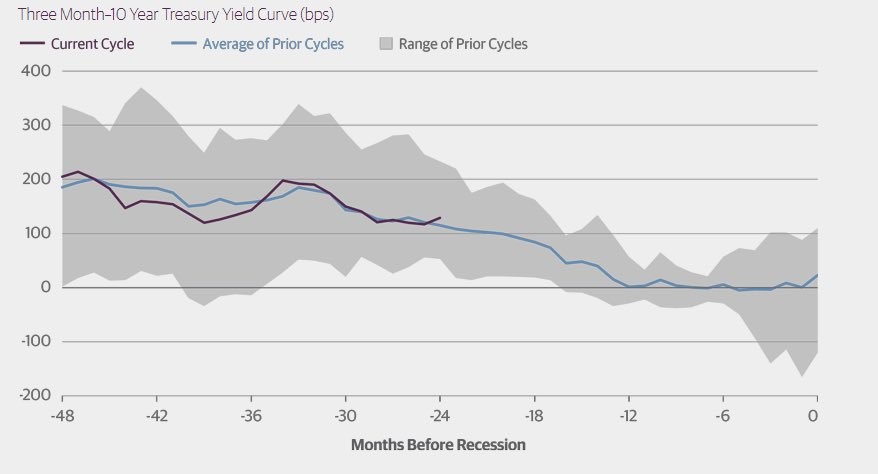
Yield Curve Warning A Recession Is Coming In 2-3 Years
It’s notable that the grey shading which represents the range of prior cycles, narrows in the period 18 to 6 months prior to the recession. That gives us more conviction in the prediction that the likelihood of a recession in the next couple of years are growing.
Stocks Don’t Perfectly Track The Economy
Stocks aren’t perfectly correlated to the economy. We’ve had that lesson drilled into our heads this cycle because it has been one of the weakest economic expansions, yet one of the strongest equity bull markets. Therefore, the sentiment cycle doesn’t align with the economic cycle. The chart below shows the average S&P 500 return before recessions.
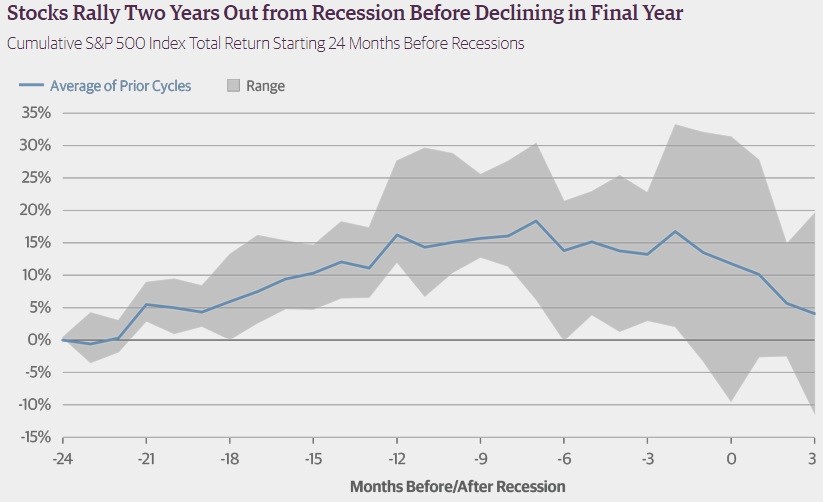
Stocks Vary Widely Before Recessions
There’s a wide variety of action right before recessions. For example, even though housing peaked in 2006, stocks peaked in late 2007. The signs of a recession could be obvious, but stocks could ignore them. This is where sector weighting is critical. It’s possible to be overweight the winning sectors while maintaining an unusually high cash position prior to recessions. Obviously, that’s easier said than done. Keep in mind that energy was the second worst performing sector in the S&P 500 in 2017. In a year where the S&P 500’s total return was 21.83%, energy lost 1.10%. Energy stocks typically do well at the end of the business cycle. It’s certainly a sector to research further.
On the other hand, just because stocks have crashed after previous recession catalysts raised red flags doesn’t mean that will happen this time. The key is to figure out the cause of the recession. If the reflexivity theory is at work and a stock crash causes an economic recession, then stocks will lead the economy lower. In 2001, the tech bubble burst helped push the economy into a recession. Even though the recession was shallow, the Nasdaq fell over 80% because of the high peak valuations.
What’s more interesting is looking at the timing of the sentiment cycle in stocks because it can improve your returns to increase your cash position in times of excess speculation. As you can see in the chart below, the cash position in Charles Schwab accounts has reached a historically low level signaling investors are highly invested in stocks. Part of the reason why cash positions are low is because interest rates are low. That being said, low interest rates are also used as justification for high valuations. If rates rise, this argument collapses.
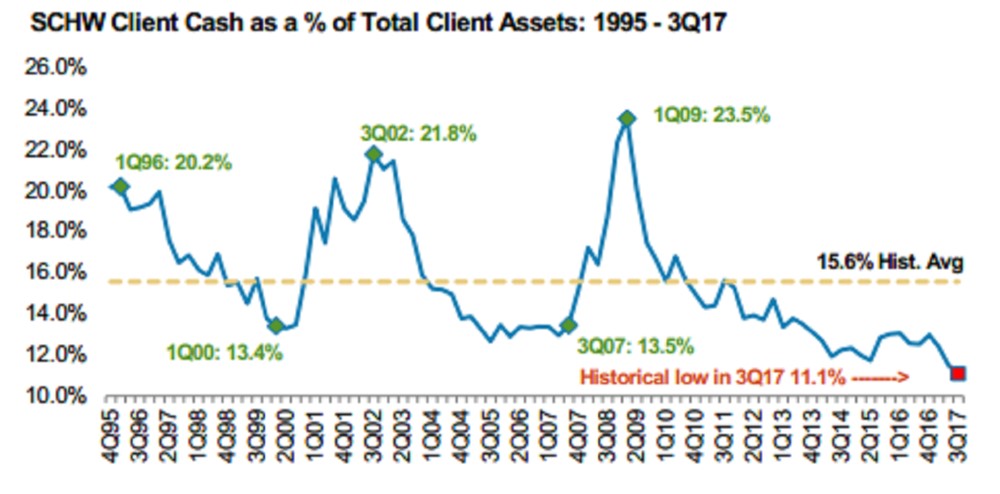
Cash Position At An All-Time Low
Leading Indicators Might Not Cooperate
Rates will cyclically increase if the economy heats up further. That’s what the leading indicators suggest as you can see in the chart below.
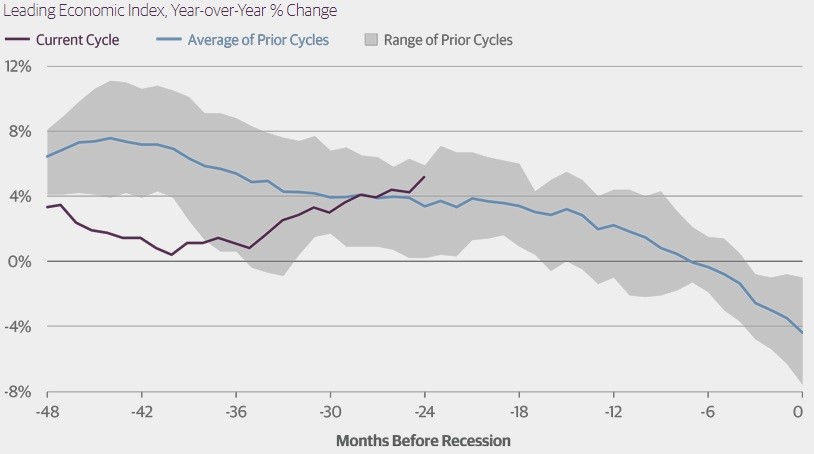
Leading Indicators Starting To Heat Up
The leading indicators shift to a deceleration phase between about 16 and 4 months before a recession. With the tax cuts anticipated to boost growth in 2018, it’s safe to say the current cycle won’t be in the range of the previous ones. It’s quite something to see a stimulus implemented after the economy has been in the 3rd longest expansion ever. If the goal is to make this the longest expansion ever, it may be achieved. If the goal is long term prosperity, the timing of this stimulus was off by a few years. Recessions can be a good thing for the economy because they remove excess speculation and debt.
Conclusion
We’ll leave you with an economic forecast from Guggenheim.
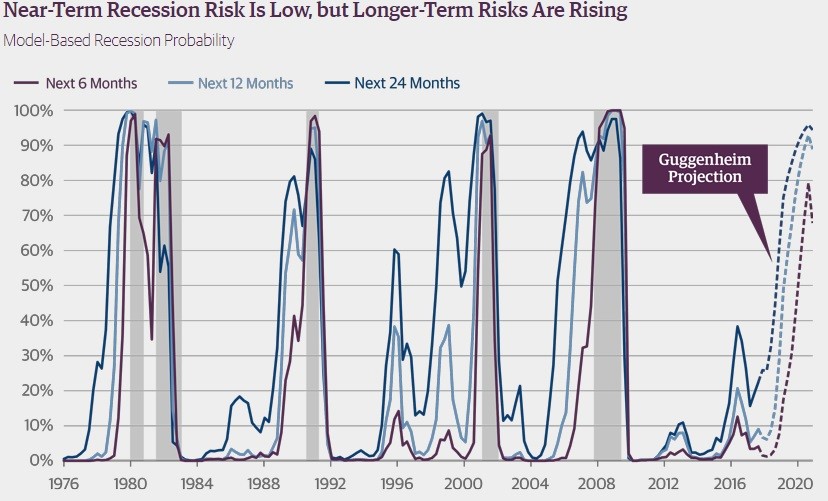
Guggenheim Predicts Recession In 2020
Guggenheim show the odds of a recession increasing in 2019, signaling a recession sometime in 2020. Since that’s a presidential election year, we could easily see the recession delayed until after the election, similar to what happened in 2016. At the same time, if the fiscal stimulus pushes growth up in 2018 and 2019, the government might be out of options to delay a recession by another few quarters. Recessions aren’t like other issues the government delays. They have historically happened even though policy makers never want them.
Have comments? Join the conversation on Twitter.
Disclaimer: The content on this site is for general informational and entertainment purposes only and should not be construed as financial advice. You agree that any decision you make will be based upon an independent investigation by a certified professional. Please read full disclaimer and privacy policy before reading any of our content.


