UPFINA's Mission: The pursuit of truth in finance and economics to form an unbiased view of current events in order to understand human action, its causes and effects. Read about us and our mission here.
Reading Time: 5 minutes
As of the beginning of 2018 there are potentially several defining aspects for the upcoming year. The two top trends of 2017 were low volatility across the board and a sizeable increase to record highs in risk on assets such as equity indexes or cryptocurrencies, which as we detailed previously is courtesy of easiest monetary conditions since 1993 according to the Chicago Fed’s National Financial Conditions Index and 1970s, according to the Taylor Rule. Despite being relatively unpredictable trends it’s not futile to come up with a preview of the upcoming year. For example, the 2016 previews predicted the Brexit vote and the U.S. presidential election would be the top events of the year and they lived up to expectations. With that in mind, let’s look at the key factors which will affect the markets in 2018. The purpose of this discussion is not to make predictions but to accurately reflect on events that have occurred, are occurring currently and what may be pertinent to the future in order to provide you with a better unbiased account on which to construct your own thesis for market timing and direction. It’s important to analyze not based on rhetoric or bias, but on facts. As those facts change, then its okay for your opinion to change.
Is The Tax Cut Rally Priced In?
For most of 2017, Congress flirted with the idea of tax cuts. When the headlines showed the GOP was considering passing a tax cut, the stock market rallied. Sometimes, intermittently, stocks fell when rumors suggested that the tax cut wouldn’t be as big as expected or the plan didn’t look like it would pass in a vote. The chances of it passing looked particularly troubling because the GOP failed at coming up with a healthcare plan. It ended up passing in December, lowering the statutory corporate tax rate from 35% to 21%. Some bears question if the stock market had already priced the tax cut in after every subsequent rally because of the rumors. However, they aren’t considering that the market probably was going to be positive in 2017 based on the corporate profit growth; there needs to be a significant rally on top of that to price it in.
If the market was perfectly efficient then it would increase based on the expected earnings increase multiplied by the percent chance of the plan passing. After the plan passed, it should have been completely priced in. However, that’s not necessarily the case. It’s often discussed how money managers need to predict the future or at least come up with accurate summations of the percent chance various events have of occurring. It’s mentioned less that the other critical part of investing is figuring out what is priced in and what isn’t. Sometimes stocks which beat earnings outperform in the subsequent days after the earnings beat is announced even though the good results should already be priced into the stock, theoretically.
With that in mind, let’s look at the affect of the tax cut on economic growth and earnings growth. The chart below compares the past 36 years of major tax bills to see their effect on tax revenues as a percent of GDP.
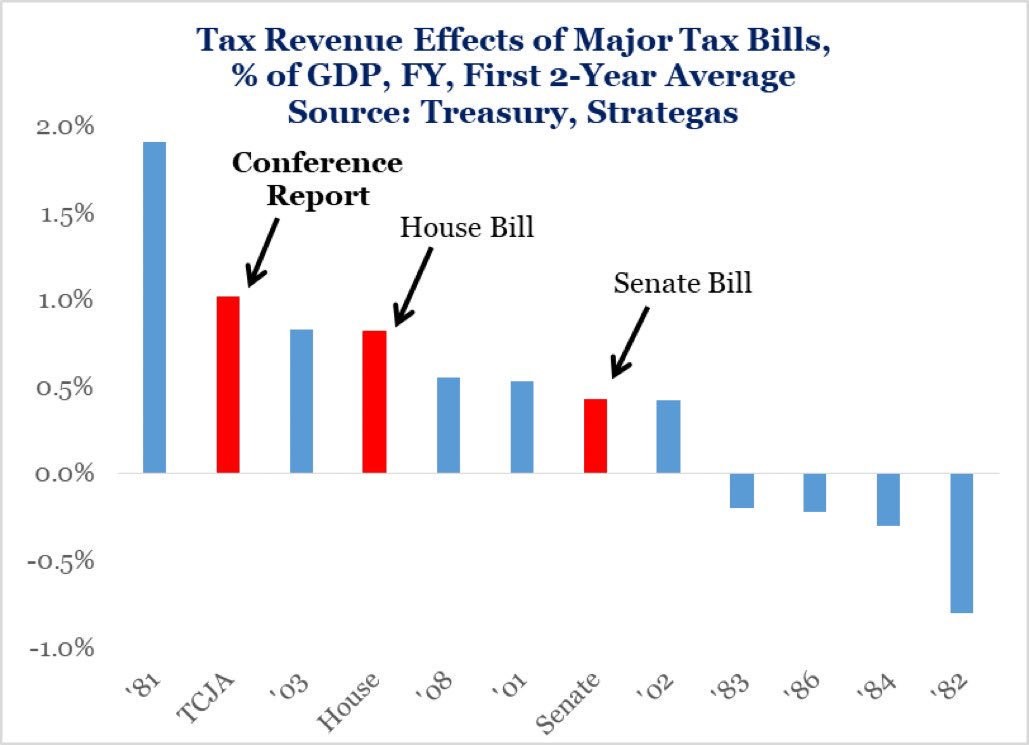
This Tax Cut Is The 2nd Largest Since 1981
It’s interesting to see that the Conference Report (the agreement between the House and the Senate) didn’t end up having an effect in between the House and the Senate bills. Instead, it is larger than both, making it the most consequential tax plan since the 1981 Reagan tax cut. Therefore, it should boost GDP growth in the next couple of years. This is a highly contentious topic which drives politically fiery debates which we will sidestep. At the very least this plan will help corporate profits since the corporate tax cut will be lowered and there will be a repatriation tax holiday for assets overseas. The repatriation tax holiday sets a 15.5% rate for cash and cash equivalent assets and an 8% rate for illiquid assets.
Clearly, this plan will help firms with a high domestic focus who pay a high effective tax rate and the firms who have a lot of capital overseas. The cash returned has historically gone to buybacks which is great for shareholders. The share count being lowered increases earnings per share. JP Morgan stated it added $10 to its S&P 500 earnings estimates because of the tax cut. Its estimate for 2018 earnings is $153 and the estimate for 2019 is $165. Their S&P 500 price target for 2018 is 3,000 giving it a multiple of 19.6. To help bearish investors understand the math behind the price increase caused by the tax cut, the S&P 500 needed to go up about 196 points on top of the normal increase in 2017. It’s debatable if the S&P 500 should’ve been increasing in the 2nd half of 2017, but it’s a fair assumption since the earnings growth was strong in Q3, excluding the hurricanes, and real GDP growth accelerated to 3.3%.
Commodities Prices & Emerging Markets
The price of commodities is critical for 2018. Firstly, their prices determine the monetary policy the Fed pursues. The data dependence of the Fed is often questioned, but as a general principal, higher inflation means rate hikes. Since the Fed already guided for 3 rate hikes, if inflation beats expectations, we could see 4 or 5 rate hikes. The Fed hiked 3 times in 2017 even though inflation missed expectations and was below the goal of 2%. Increasing commodities prices and a hawkish Fed were the recipes for the last recession. The concept of commodity price inflation causing a recession is simplistic, but sometimes simple works for analysis. There’s no need to add to the complexity for no reason. The difficult part is forecasting where commodities are headed.
Even though increasing commodity prices are bad for the US economy, it’s great for most emerging markets because they rely heavily on exporting commodities. Commodity prices are a catch 22 because when they increase because of demand, it signals the economy is strong, but when prices overheat, they push down demand, causing a recession. The chart below compares the emerging markets price index to commodities. As you can see, the two have been highly correlated in the past 20 years.
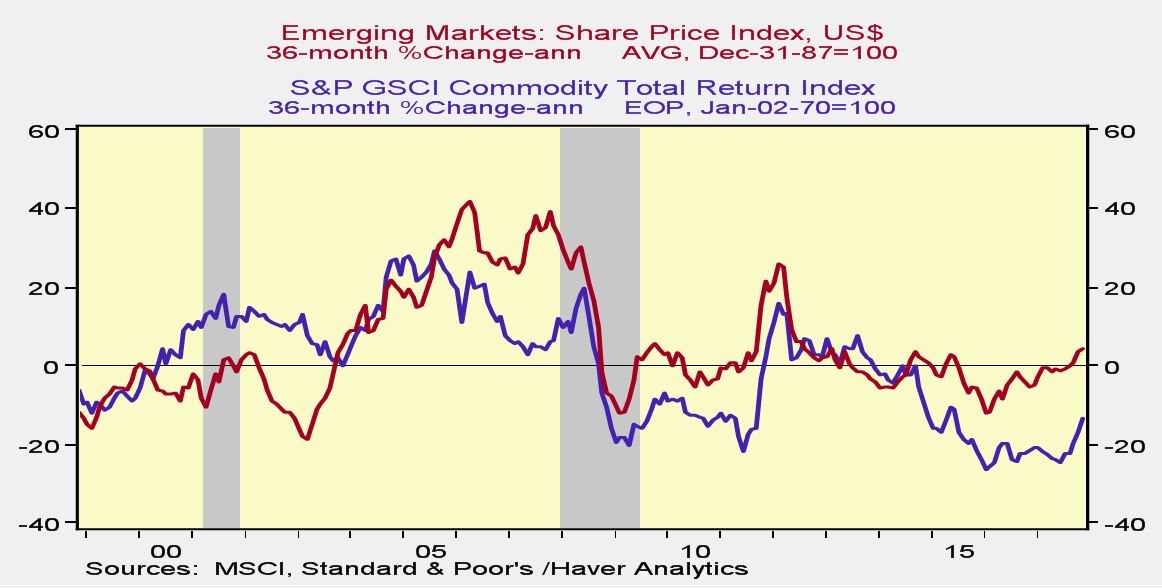
Commodities Drive Emerging Markets
Judging by the chart above, it could be argued that commodity prices have been lagging emerging markets for the past few years.
How Could Increasing Commodity Prices Impact Equity Markets?
Global growth is more important to many S&P 500 companies than domestic growth. The 10th column in the table below breaks down the percentage of sales which come from the US by sector.
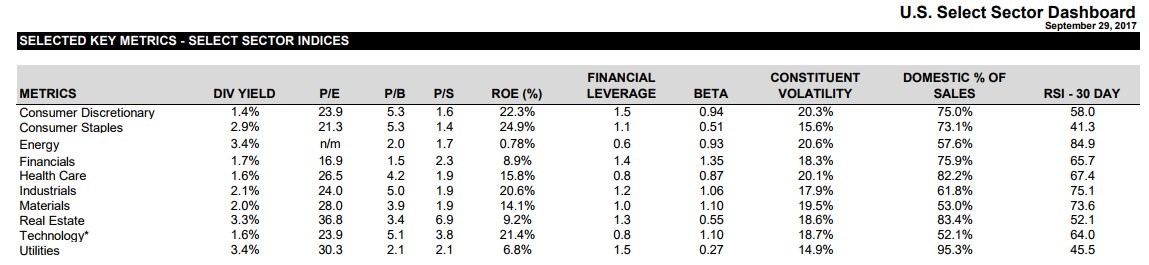
S&P 500 Sector Dashboard
100% minus this gives you the international exposure. As you can see, the tech sector is the most internationally focused. Emerging markets drive global growth as emerging market GDP growth in the past 10 years has been 4.2% while developed market growth has only been 1.1%. Interestingly, real earnings growth has been -0.6% and -1.0%. This has to do with the sector weighting of the indexes and the high dilution rate in emerging markets as they have a lot of IPOs. With US companies exploring the economies with the most growth and the shakiness of emerging market’s capital markets earnings, the S&P 500 can be a better idea than owning respective country indexes at times. According to Deutsche Bank, 15% of S&P 500 earnings come from emerging markets. This also shows how important their growth is to US equities.
Conclusion
There will be many themes to focus on in 2018. Two of the ones we touched on in this post are the effect the GOP tax cut will have on corporate profits and the effect commodities prices could have on monetary policy and emerging markets which are critical to global GDP growth as well as S&P 500 earnings growth.
Have comments? Join the conversation on Twitter.
Disclaimer: The content on this site is for general informational and entertainment purposes only and should not be construed as financial advice. You agree that any decision you make will be based upon an independent investigation by a certified professional. Please read full disclaimer and privacy policy before reading any of our content.


