UPFINA's Mission: The pursuit of truth in finance and economics to form an unbiased view of current events in order to understand human action, its causes and effects. Read about us and our mission here.
Reading Time: 5 minutes
The Perfect Scenario For Stocks
With the economy regaining steam in 2017, the number one risk to equities and economic expansion is inflation. The current economic expansion hasn’t produced inflation, as measured by core CPI, because the growth in inflation as a result of QE has been subdued to mainly financial assets. The chart below shows the current payroll growth compared to prior expansions.
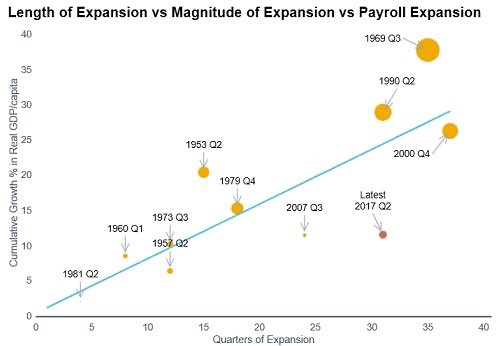
Size Vs Length Of Expansions
It shows how even though the expansion is longer than most, the magnitude is small. The cumulative gains in real GDP per capita haven’t been impressive. If 2017 and 2018 finally show the growth rates associated with normal expansions, inflation will follow. The lack of inflation has been good news for stocks, but not great for workers looking for real wage growth. Usually, inflation causes the Fed to hike rates which slows loan growth. It has been delayed, but inflation might be rearing its ugly head soon.
Before we get into the reasons why inflation might increase, let’s review the current business cycle. As you can see, this cycle has seen low inflation and low unemployment.
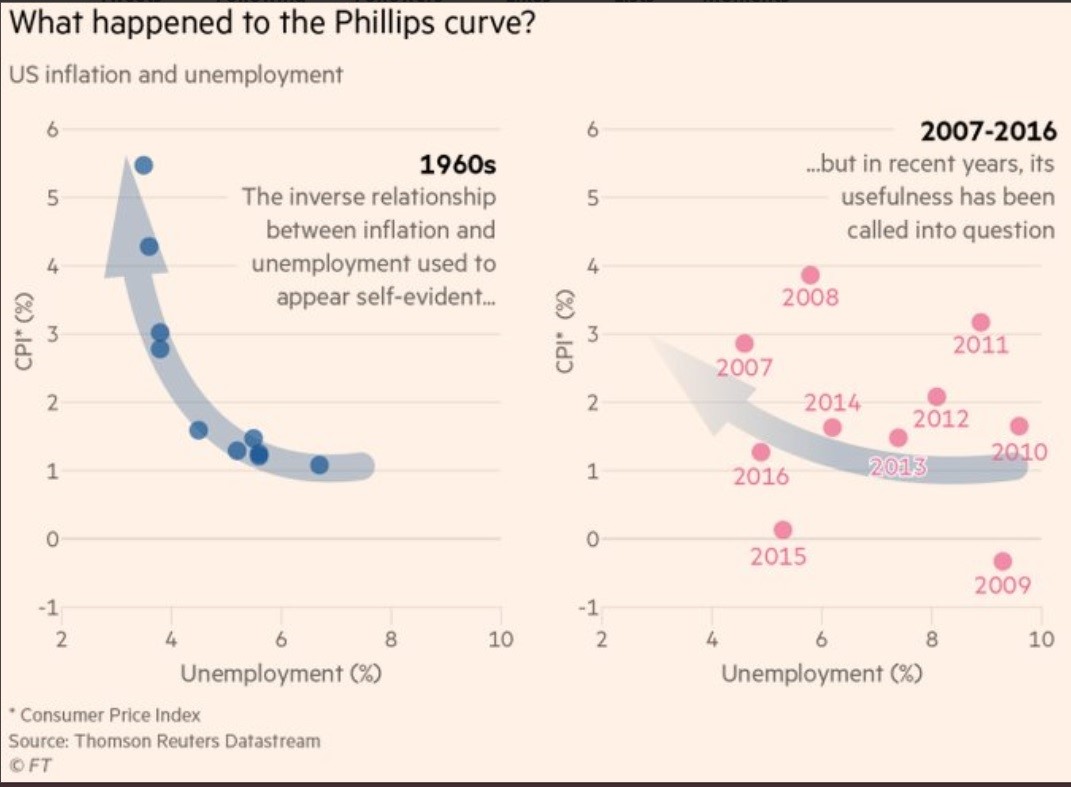
Low Unemployment Hasn’t Caused Inflation
That’s a scenario which hasn’t existed in the past. It’s been the reason why stocks have done so well. It’s arguable that diminished growth combined with low inflation is the perfect situation for stocks. S&P 500 profit margins being at record highs certainly supports that hypothesis. Stock multiples will fall if inflation rises. The question for stocks will be if costs increase faster or slower than sales. The faster GDP growth rate helps sales, but the higher inflation pushes up costs. The metric which will determine the answer to this question is productivity growth. The good news is wage inflation encourages fixed investment which boosts productivity. These investments and productivity show signs of life in 2017. The question is if that can continue. Earnings growth will need to make up for shrinking multiples if stocks are to rise in 2018.
Inflation Could Be Coming
The first chart implying that inflation could rise in 2018 is shown below.
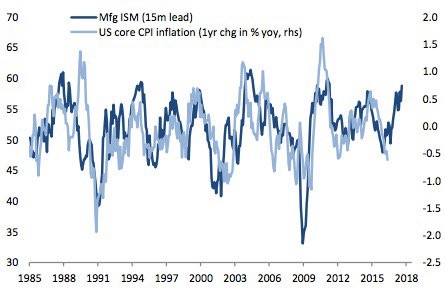
ISM Signals Inflation Coming
It compares the manufacturing ISM with the US core CPI inflation rate of change. The ISM has a 15 month lead. As you can see, the two metrics are highly correlated. Even in this cycle, which has broken some pre-conceived notions about inflation, the two have acted in tandem. The manufacturing economy is recovering from the recession in 2015-2016, which central banks helped prevent; the Asia Pacific region has been the fastest growth area according to 3M and Caterpillar. This chart implies core CPI in 2018 can be about 0.7% higher than this year. The core CPI in September was 1.7% which means next year might see 2.4% core CPI. That is above the Fed’s target of 2% inflation which means rate hikes would accelerate. The current guidance is for two hikes in 2018; inflation beating estimates means three hikes or more might be in the cards. The highest core inflation this cycle was 2.33% in February 2016. In the previous cycle, inflation peaked 14 months before the recession. Heightened inflation could mean a recession in 2019 if the economic path is the same.
The chart below shows another indication that inflation will pick up in 2018 causing stock multiples to fall and the Fed to raise rates.
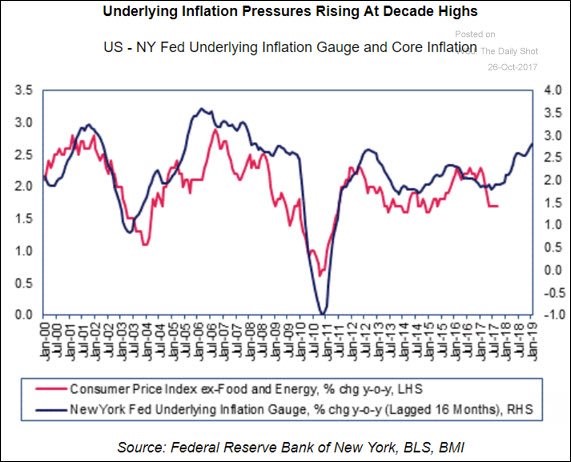
NY Fed Inflation Gauge Signals Higher Prices
The NY Fed underlying inflation gauge lagged 16 months is a great predictor of core inflation. Keep in mind the difference between this chart and the one above. This chart shows the change in prices while the ISM chart shows the change in CPI meaning it’s a derivative of prices. The ISM chart above implied about 2.4% core inflation. The NY Fed forecast gauge shows about 2.8% inflation, but it’s usually higher than the actual result. 2.4% seems like a reasonable projection for 2018 based on that factor.
US M2 Velocity Of Money
The final chart which implies inflation will increase is the one which compares core CPI to M2 velocity with a 21 month lead.
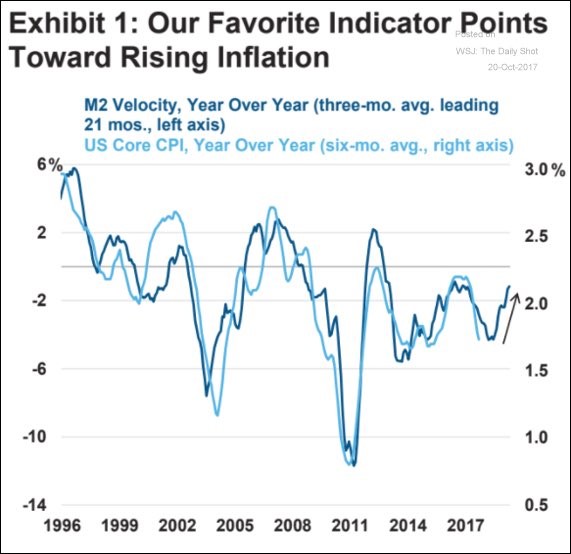
M2 Money Supply Signaling Higher Inflation
Money velocity is the rate at which currency is exchanged from transaction to transaction. Another way of defining it is the amount a unit of currency is used in a specific period. The M2 money supply includes cash, checking deposits, savings deposits, money market securities, mutual funds, and other time deposits. As you can see, the speed at which these assets are transacted implies core CPI will increase to about 2.2%. This is the most modest increase, which would do the least damage to stocks, out of the 3 charts we reviewed. It’s tough to compare equities in late 2015-early 2016 to 2018 because that period in late 2015-early 2016 had recession fears which probably won’t exist next year. The stock market was fixated on the Brexit vote and the U.S. presidential election in the middle-late 2016 period. What we’re saying is that the stock market won’t necessarily mimic that period’s performance if core inflation is near the same rate.
Speaking of recessions, if inflation is higher than wage growth, than it will feel like a recession for the people at the bottom rung of the economic ladder. As you can see from the survey below, there is an unfortunately high percentage of renters who were unable to pay their whole rent in 1 of the last 3 months.
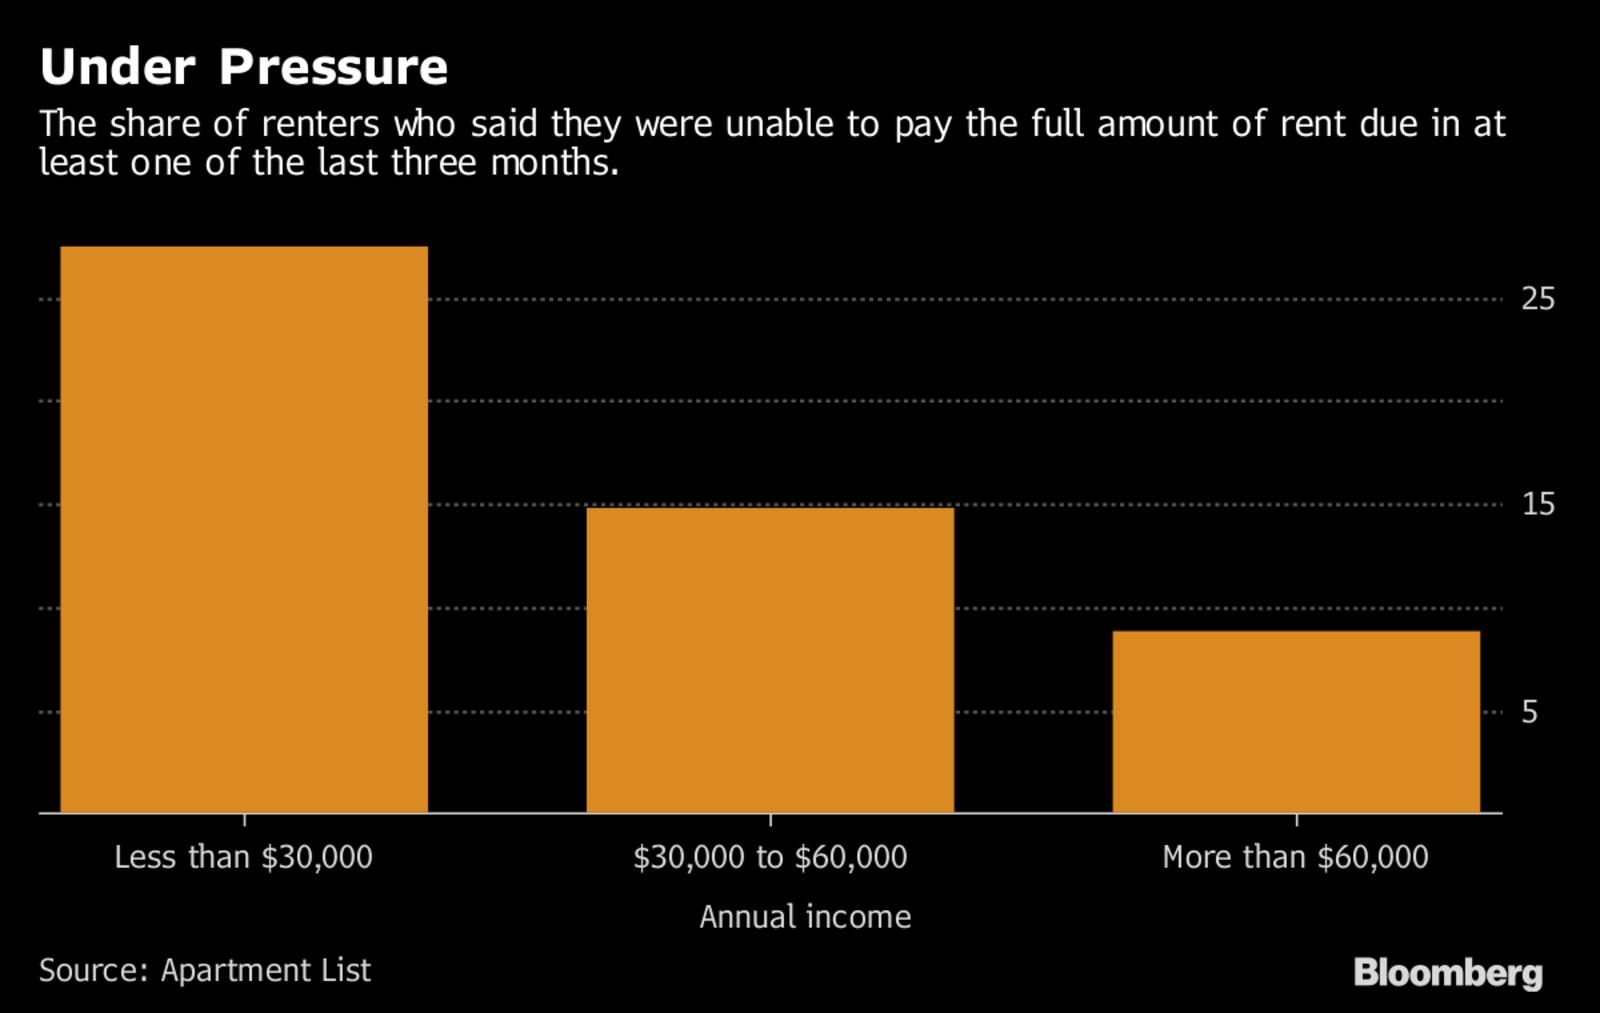
The Poor Can’t Pay Their Rent
The numbers get higher the lower down the income scale you go. Inflation means rising living expenses for these people. That would put those who are now in a bad situation, in a dire one. It’s the equivalent of low level areas with poor people getting hit with a storm. The question is whether inflation comes from commodities and shelter expenses or it comes from wages. Even if there is wage growth, it will need to trickle down to the low skilled workers to make up for higher costs for day to day expenses.
Conclusion
In the past 8 years, the economy has flirted with the prospect of finally emerging from the low growth trajectory it has been on. This scenario would bring wage growth, but it would also bring inflation which could lead to the beginning of the end of this business cycle. We have heard bears talking about how this business cycle is almost over for at least 2 years. The reality is it likely won’t be near the end until inflation accelerates. To be clear, the next recession won’t necessarily occur in 2019. The timing depends on how hot inflation gets. If core inflation is below 2.5%, the situation won’t be that bad. If it gets close to 3%, there would be a problem.
Have comments? Join the conversation on Twitter.
Disclaimer: The content on this site is for general informational and entertainment purposes only and should not be construed as financial advice. You agree that any decision you make will be based upon an independent investigation by a certified professional. Please read full disclaimer and privacy policy before reading any of our content.


