UPFINA's Mission: The pursuit of truth in finance and economics to form an unbiased view of current events in order to understand human action, its causes and effects. Read about us and our mission here.
Reading Time: 5 minutes
As we’ve discussed in previous articles, the wage growth for production & non-supervisory workers isn’t where it should be according to some metrics. The chart below illustrates this point perfectly as the job openings and labor turnover survey shows hiring has picked up, but wage growth hasn’t.
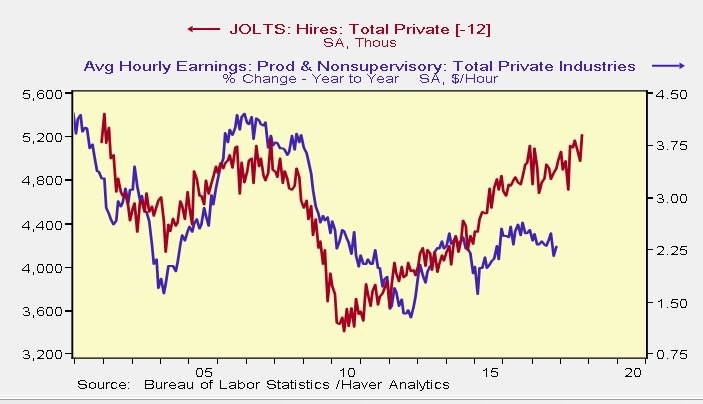
Average Hourly Earnings Growth Disappointing
The Atlanta Fed wage growth survey shows growth of 3.4% in October, and slowed to 3.2% in November, which is higher than the average hourly earnings growth depending on which jobs are included in each survey. We will breakdown the wage growth in a few sectors of the economy later. First, let’s mention that the Atlanta Fed shows full-time wage growth started to vastly outperform part-time wage growth around the time when the average hourly earnings started to diverge from the hiring growth. The full-time wage growth in October was 3.5% and 3.6% in November, but it was only 2.1% for part-time workers in October and 2.2% in November. There has been a large increase in the number of diversified workers in the past few years. Many of them haven’t seen the wage growth their full time counterparts have witnessed.
Bottom Quintile Of Workers Led By Security Jobs
The labor market is diverse; there are many different trends ongoing at the same time. Just looking at the overview of the data doesn’t tell the whole story. One interesting aspect is the bifurcated trends in wage growth for workers within the bottom quintile. The chart below shows the nominal wage growth for the bottom 20% with and without security jobs.
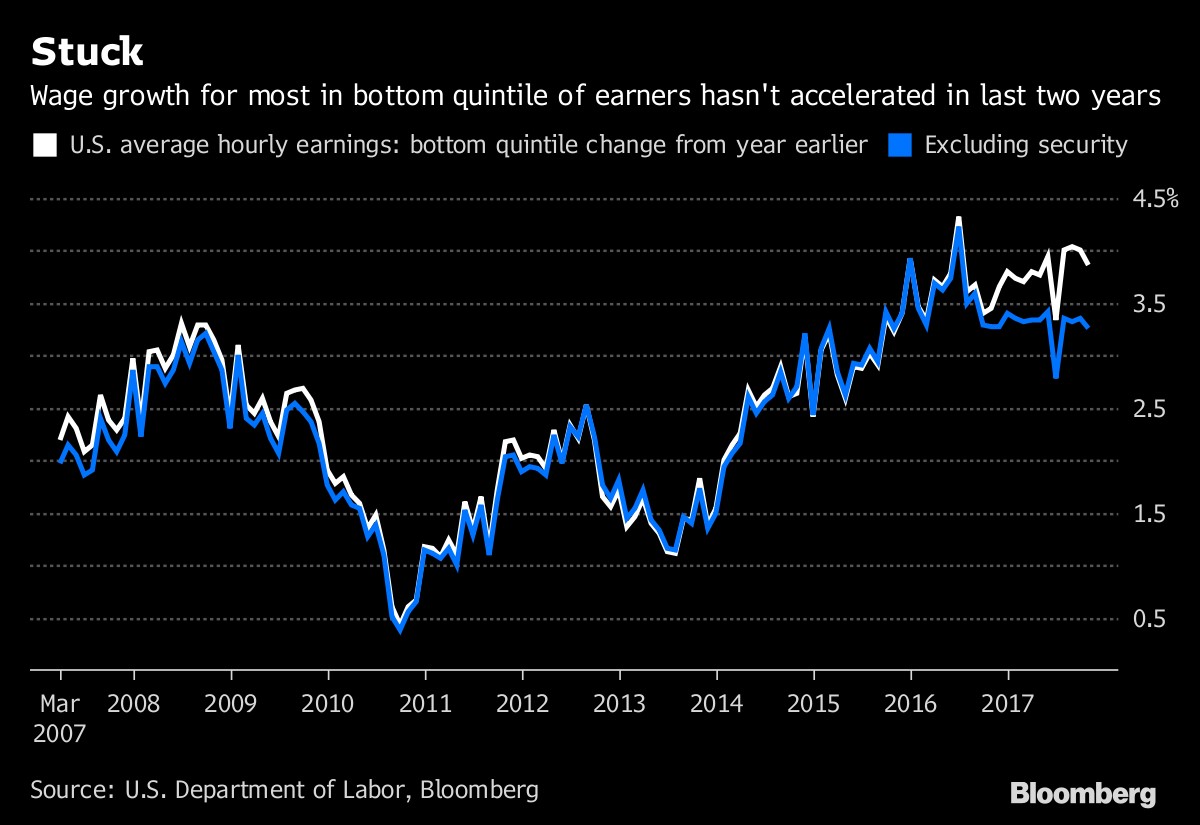
Ex-Security Wage Growth Not Great
Firstly, let’s mention that wage growth has looked good for these low wage growth workers. This information from the department of labor matches the Atlanta Fed’s report which breaks down wage growth between low-skilled, mid-skilled, and high skilled workers. At the end of the business cycle, low-skilled workers usually catch up to the other jobs. We’re making the comparison between low-skilled and low paid workers which doesn’t perfectly overlap, but works in this case.
The chart shows that all isn’t perfect for these low paid workers as the wage growth is being driven by security jobs which have seen almost 20% wage growth this year. With the security jobs, wage growth in October was 3.9% which is up from last year’s 3.4% growth, but without security jobs, growth falls to 3.3%. Remember, this is nominal growth, so take out inflation to get the real growth rate. You might ask, why take out the surging segment of workers? Well, security only makes up 0.6% of workers, so it’s manipulating the average too much compared to how many workers it employs.
Even though restaurant sales growth has been weak, the wage growth in workers in the industry was 4.4% in the first 10 months of 2017. One explanation for that is fast casual restaurants overbuilt. This segment rode the excitement created by Chipotle a few years ago. It turns out not every concept will turn into a winner which can open new locations across the country. While opening too many restaurants can oversaturate the industry, they still need to employ workers. The waiters and waitress labor market has thrived this year. On the other hand, the general merchandise stores have only doled out nominal wage growth of 1.4% as they have been hurt by online retailers. This shift in jobs from brick and mortar stores to online retail firms is an example of an aspect that makes wage growth tough to track since the jobs at e-commerce stores are different, for example, some of them aren’t low-skilled jobs.
Is Tight Policy Coming?
With wage growth mediocre according to some metrics and decent according to others, this has led to middling inflation in 2017. Core CPI needs wage growth to push higher in 2018, especially with shelter inflation decelerating lately. The chart below shows the Fed funds rate minus the core CPI. With the Fed raising rates 75 basis points in 2017 and inflation staying stagnant, the difference between the two has shrunk. It has shrunk more than the chart below indicates because it doesn’t include the 25 basis point hike in December.
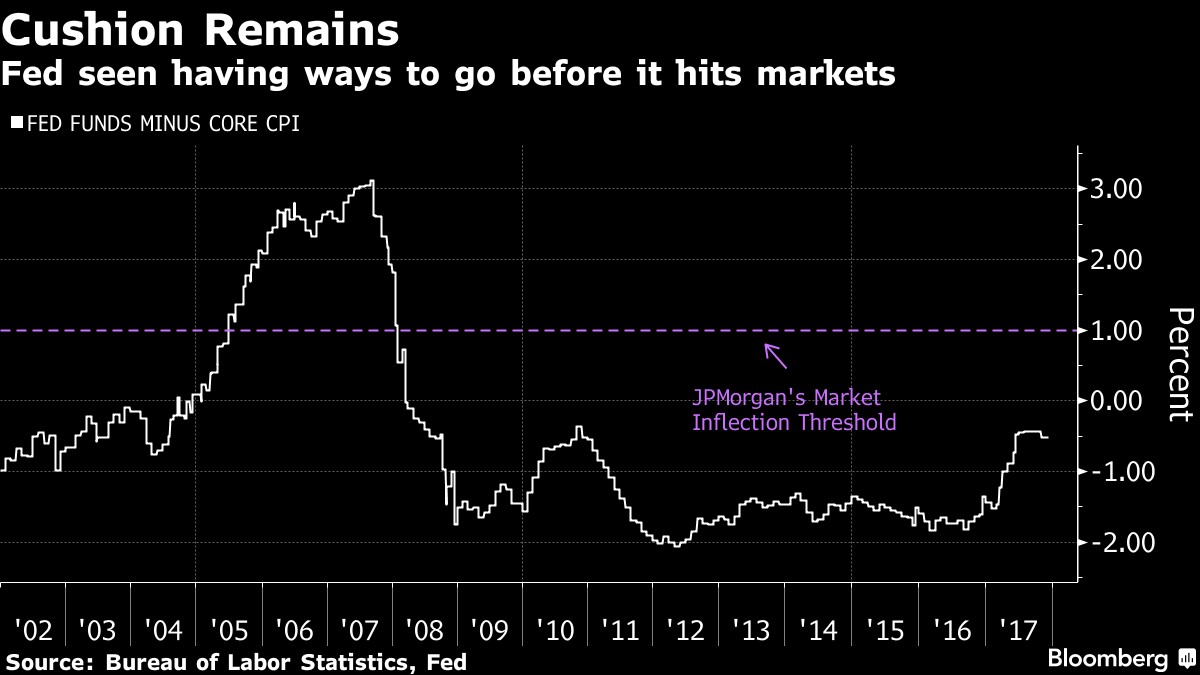
Red Flag Will Be Waved In 2019
JP Morgan believes when the Fed hikes rates to 1% above core inflation, it pushes the business cycle towards its end, catapulting the economy into a recession. Either inflation will go up in 2018 or that might come close to occurring because the Fed has guidance for raising rates another 75 basis points. The median Fed funds rate expectation is 2.7% in 2019, which would trigger this red flag if there’s stagnant inflation. Although heightened inflation would prevent this recession indicator from going off, if it grows too much, it could hurt stocks and the consumer’s purchasing power. In 2017, the economy was in a Goldilocks state where economic growth was solid and inflation was low. The Fed is taking away the punch bowl in 2018. The hope is inflation increases slightly and growth accelerates. This balancing act can go wrong in two ways. The Fed can raise rates too quickly which would push down economic growth. That’s the ‘too cold’ scenario. Inflation can accelerate too quickly because of the stimulative policies still in place. That’s the ‘too hot’ scenario.
Tight Policy Might Be Here Already
The chart below is an alternative to the stationary analysis done by JP Morgan.
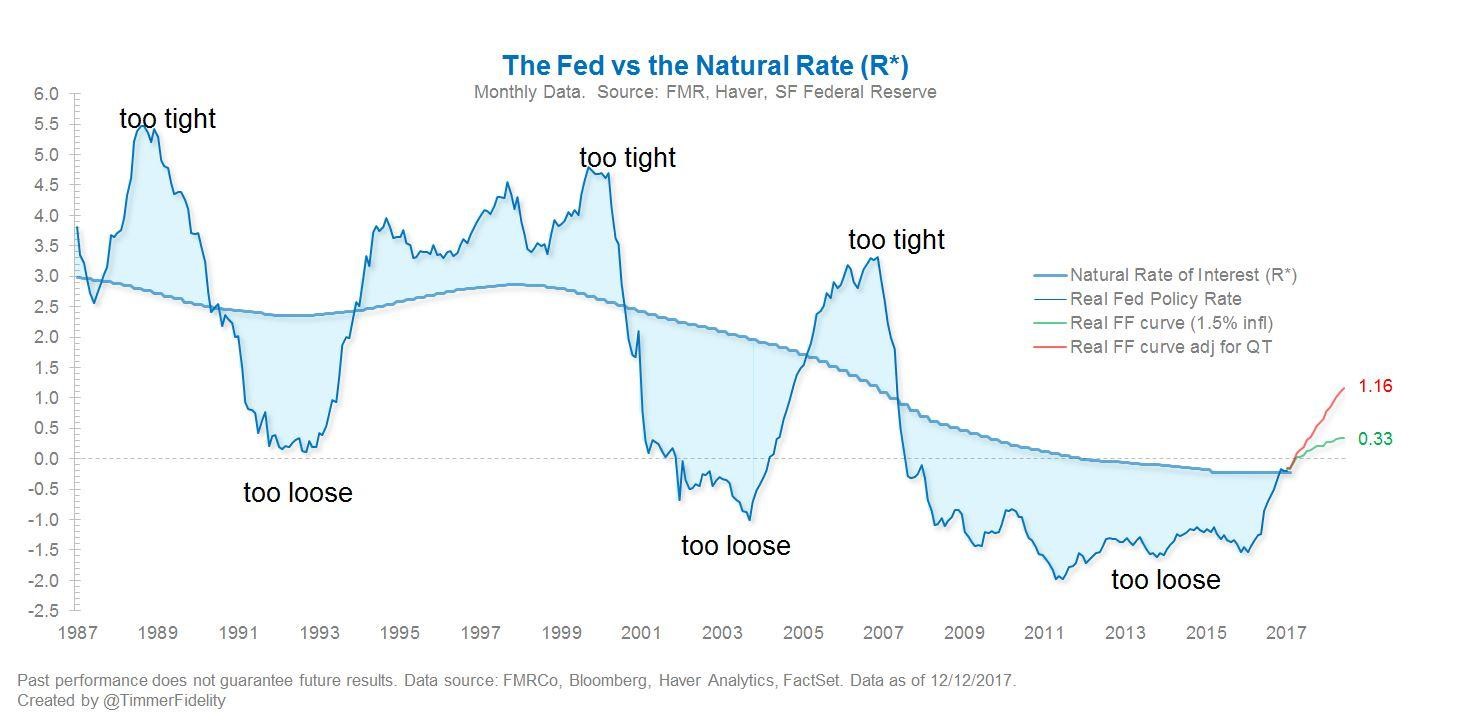
Fed Might Be Too Tight In 2018
This analysis is more dynamic by including the natural interest rate and the effect of QE tightening. The conclusion this chart arises at is that the Fed funds rate will be too tight in 2018. When you include the Fed’s balance sheet unwind, which will accelerate to $20 billion per month in January, the tightness is more expansive. The last time this tight policy was put in place, the financial crisis occurred about 2 years later. However, policy was too tight for about 5 years before the recession in 2001 and that one was much shallower.
Conclusion
Novice investors see the 2017 situation as a rule, believing that a Goldilocks scenario is normal. Neither a financial crisis like 2008 nor a Goldilocks scenario are normal. Usually, the situation is somewhere in between. If inflation gets too high or economic growth falls, the stock market could experience higher volatility in 2018 than 2017. This is far from something you should fear. Even if rates are too high, a recession won’t necessarily occur. Higher volatility in one of the quietest years ever is hardly Armageddon.
Have comments? Join the conversation on Twitter.
Disclaimer: The content on this site is for general informational and entertainment purposes only and should not be construed as financial advice. You agree that any decision you make will be based upon an independent investigation by a certified professional. Please read full disclaimer and privacy policy before reading any of our content.


