UPFINA's Mission: The pursuit of truth in finance and economics to form an unbiased view of current events in order to understand human action, its causes and effects. Read about us and our mission here.
Reading Time: 5 minutes
2017 marked what could be considered a seemingly perfect time in history. Some of the primary factors that contributed to this goldilocks scenario has been record low interest rates and volatility, quantitative easing, high stock valuations, easiest financial conditions since 1993 based on the National Financial Conditions Index or from 1970 based on the Taylor Rule, which arguably was part of the catalyst for excessive speculation in cryptocurrencies. But something every investor should always remember, past returns are not an indicator of future performance. This is not to say that we are headed for some imminent crash, baring any unforeseen event, but that as valuations increase, so too does the risk adjusted return.
Stock Valuations Are High
One of the best metrics of stock valuation is the Shiller PE. It shows the inflation adjusted 10 year earnings multiple of the S&P 500 or any other market. The current Shiller PE is 32.5. Going back to the 1880s, it has only matched this level at the peak of the 1929 bubble and the 1990s tech bubble. While these last two periods resulted in historic downturns, its not that many data points to compare this market to. The more data points, the better we can understand future probabilities. Therefore, we have the chart below which shows all the countries’ historical Shiller PE ratios.
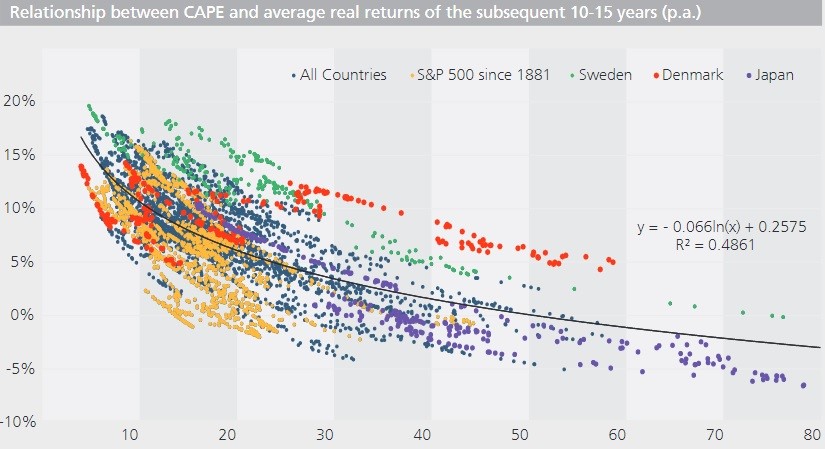
CAPE Implies Low Returns In U.S. Stocks
With this information, particularly from Japan, which had a monster bubble in the 1980s (peaked in 1990), we can come up with a curve fitted to this data which gives us the most likely 10-15 year average returns. This curve shows us the U.S. stock market is likely to return somewhere between 0% and 5% per year in the next 10-15 years. That’s a grim realization given that the S&P 500 rallied around 20% in 2017. What makes it worse is there will likely be a significant correction during that underperformance.
Why Stock Valuations Are High
There are many reasons why the Shiller PE is at extreme levels. The first reason is interest rates are low. While the Shiller PE adjusts for inflation, the low rates have clearly encouraged buyers to pay more for stocks than what the Shiller PE adjusts for. There is no other option for investors. Americans, in general own a higher amount of equities than other nations.
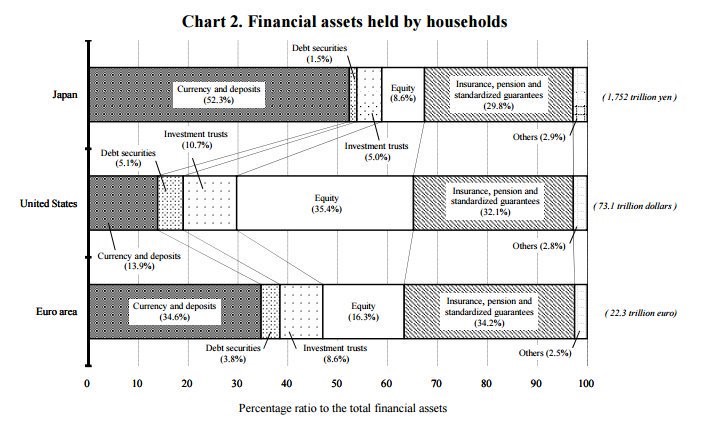
Americans Have A Lot In Equities
35.4% of household financial assets are equities. This compares to 8.6% in Japan and 16.3% in Europe. It’s not surprising to see the Japanese shy away from stocks since they were burned in the 1990s. There’s also demographics at play as baby boomers are at their peak wealth right before retirement and have their money in stocks.
Another reason stocks are expensive is because there hasn’t been a recession in a while. As of early December, this expansion has been 102 months. That’s the third longest expansion since 1854. The 2nd longest was 106 months, from 1961 to 1969. In that period, the nifty 50 stocks were popular, akin to today’s FANG stocks. Stocks were historically expensive then. The longest period without a recession was 120 months from 1991 to 2001. That period is when the internet tech bubble exploded. If this expansion continues to early 2019, it will be the longest expansion since 1854. That certainly qualifies as interesting times.
As we mentioned, the tech bubble housed the most expensive valuations in US history. The chart below shows that the S&P 500 price to revenue is near the peak in 2000.
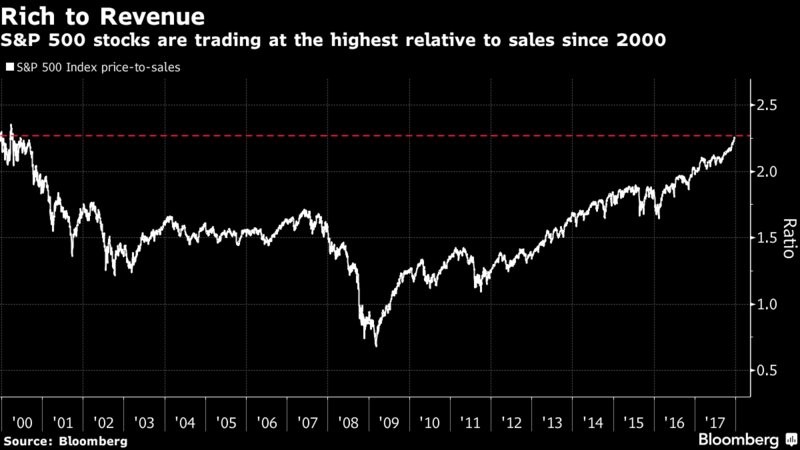
Near Record High Price To Sales Ratio
The reason stocks have near record price to sales ratios, but not close to record earnings multiples is because profit margins are at record highs. Ironically, margins are being boosted by technology companies. The most speculative tech names in the 1990s barely had revenues, similar to the cryptocurrency startups of today. Now tech stocks have the most earnings power and the highest margins. This makes the chart above much less concerning.
Global Unified Expansion
2018 is expected to have the fewest countries in a recession ever. The chart below, which shows that 0 countries had contraction in the purchasing managers’ index in 2017, gives you a taste of how this global expansion in the past year has been synchronous.
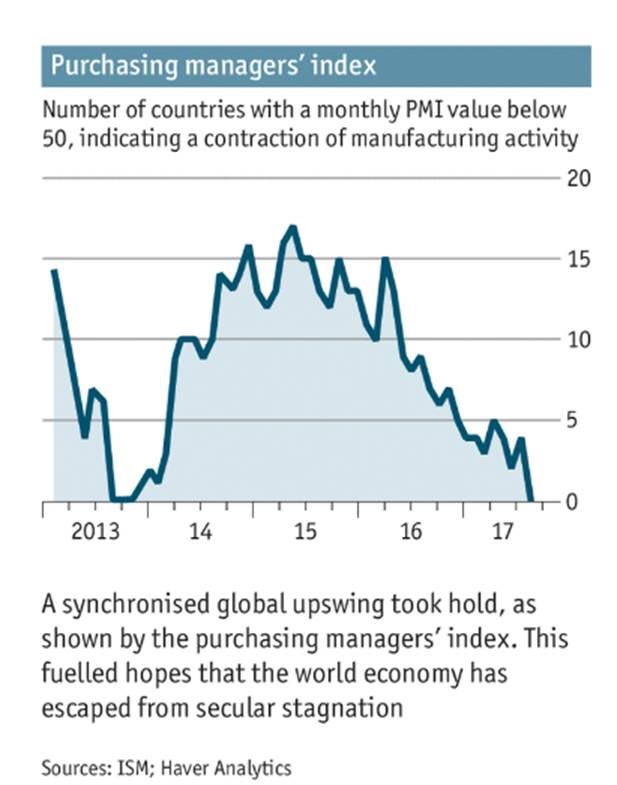
PMIs Are Expanding Everywhere
America is near the longest expansion, while almost every country is growing. What could go wrong?
Inflation Could Ruin The Party
Investors who have only a few years of experience have a warped view of inflation because it has been historically low. Global central banks have desired for inflation to increase. The rationale behind this logic is that inflation implies growth (demand) is strong and when inflation comes from wage growth it’s a good thing. The bad kind of inflation is commodity price increases. The problem is that when easy monetary policies are put into place to stimulate inflation, the economy gets the good along with the bad. This is why when inflation gets too high, central banks increase rates, which forces a recession to occur and decreases inflation.
The chart below shows the 10 year breakeven inflation rate in America.
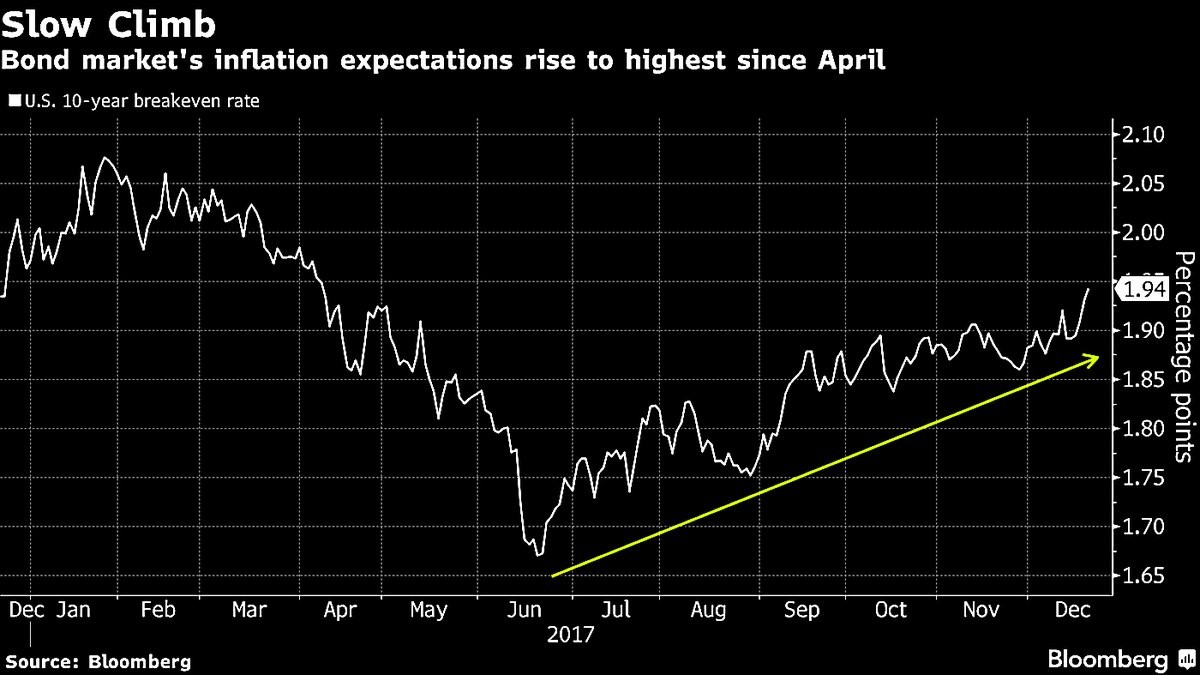
Inflation Is Increasing
The breakeven inflation rate is the free market determination of what inflation is. It is calculated by subtracting the 10 year TIPS (Treasury Inflation Protected Securities) from 10 year Treasury yield. As you can see from the chart above, the 10 year breakeven inflation rate has been increasing in the 2nd half of 2017, but inflation is not even at the peak of this business cycle which was 2.64%. However, the low unemployment rate, the cyclical growth acceleration, and the length of this expansion all combine to signal inflation will increase in 2018, as we have detailed previously.
Conclusion
Catalysts for lower valuations include, but are not limited to: a recession, higher inflation, aging demographics, central banks raising rates and ending quantitative easing, and/or a negative geopolitical event. After the goldilocks scenario of 2017, there’s huge recency bias combined with FOMO (fear of missing out). If historical performance is any guide, equities will not provide great performance over the coming 10-15 years based on current valuations. In fact, this may be a prudent time for companies to raise capital instead of buying back shares. This perspective isn’t very time sensitive, so don’t expect anything to happen imminently. Those who misconstrue prudence for day trading come back to value investors and complain to them about their forecast a few months after it was made. A few months is a long time in a bear market, but it’s nothing in a bull market. Patience and prudence are key in late cycle markets. One day, fundamentals will matter again.
Have comments? Join the conversation on Twitter.
Disclaimer: The content on this site is for general informational and entertainment purposes only and should not be construed as financial advice. You agree that any decision you make will be based upon an independent investigation by a certified professional. Please read full disclaimer and privacy policy before reading any of our content.


