UPFINA's Mission: The pursuit of truth in finance and economics to form an unbiased view of current events in order to understand human action, its causes and effects. Read about us and our mission here.
Reading Time: 6 minutes
Panic About Inverted Yield Curve
There has been a lot of discussion about the inverted yield curve lately. The purpose of this article will be to dispel any rumors that exist about what this symbolizes for the economy. There are a three categories of metrics investors with a keen focus on macro economics need to focus on: company specific metrics researched through reading regulatory filings and researching the competition; the mainstream economic reports such as the ISM reports and the jobless claims; and forecasting metrics which can help you understand where the economy is headed. These forecasting metrics don’t just help you time recessions. They help you figure out where the economy is in the business cycle.
Certain sectors do better in each part of the business cycle. The parts are the following: recovery, mid cycle, late cycle, and recession. As of late-2017 the U.S. economy is probably in the late cycle, but some of the emerging markets economies are acting as though we are in the early part of the cycle, a response that is happening due to the high levels of monetary stimulus. We’ll discuss which sectors do well in the late cycle economy in this article.
Yield Curve Is A Valuable Forecasting Tool
One of the forecasting tools used to pick out where the economy is in the business cycle is the yield curve. The yield curve is a line plot of the treasury yields matched with their maturity dates. In a normal curve, the yields increase with longer dated bonds. With an inverted curve, the yields are lower as the maturity dates are further in the future. A normal yield curve is associated with expansions; an inverted yield curve is associated with warnings about recessions.
The Fed plays a role in affecting the short end of the curve with the Fed funds rate. Central bank fed funds rate hikes which go too far can push short-term rates higher than long-term rates, which is an inversion of the yield curve. Usually the Fed hikes rates because inflation is increasing and needs to be tamed. In the last couple of cycles, oil price rallies caused inflation to increase, pushing the Fed to raise rates. While inverting the curve and causing a recession isn’t ideal, sometimes it’s necessary to save the economy from excess inflation. After an inversion of the yield curve occurs, the Federal Reserve cuts rates, generally as this is correlated with an economy that is faltering, which is a result of the initial hiking of rates. As you can see, the Fed creates its own feedback loop that requires it to do and undo its actions. However, at this stage of the cycle something different has been happening – the Fed has been raising rates despite low inflation as measured by the core PCE and CPI.
Looking Into The Late Business Cycle Dynamics & Inverted Yield Curve
As of December 4th, the difference between the 10 year yield and the 2 year yield was 59.9 basis points. As you can see from the grey line below, that implies the economy is at the end of the cycle as it was above 250 basis points in the beginning and middle of the cycle partially because the Fed had rates at 0%. The chart demonstrats that as an inverted yield curve occurs, the final domestic demand growth falls.
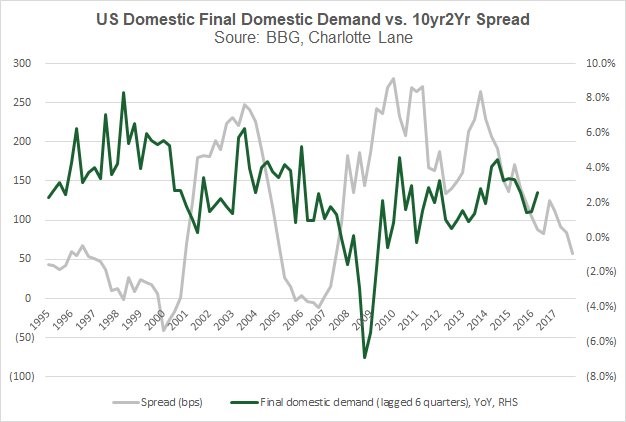
An Inverted Yield Curve Implies Demand Weakness
A flattening yield curve doesn’t imply domestic demand growth will falter in 2018 because the signal for a recession occurs only when the curve inverts. Even then, there could be a delay between the the inverted yield curve and an actual recession, as this occurred in the late 1920s.
Are We About To See An Inverted Yield Curve?
Mathematically, we are nearing an inverted yield curve since it has flattened about 200 basis points and needs to flatten 60 more basis points to be inverted. However, the timing isn’t that simple. The curve doesn’t uniformly flatten like how an hourglass measures time. It might take a few months for an inversion to occur or a few years. The table below details the time it takes for the yield curve to fall from 100 basis points to an inversion.
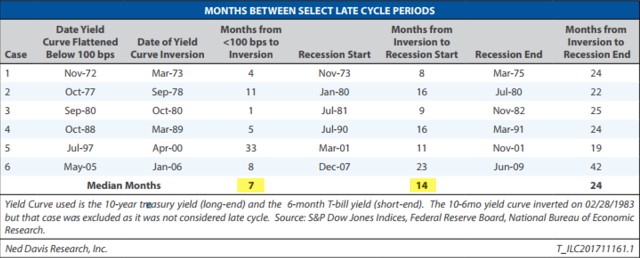
Length Of The Flattening Period
Keep in mind, this chart uses the 6 month treasury bill as the short end and the 10 year bond as the long end. As of December 4th, the difference between the 6 month and the 10 year yield was 97.5 basis points. As you can see, the inversion time has varied from 1 month to 33 months, with the median being 7 months. The inversion doesn’t signify a recession is coming right away; there’s usually a sizable gap between the inversion and the recession which is why the chances of a 2018 recession are slim according to this indicator. The median time from an inversion to a recession is 14 months, varying from 8 to 23 months.
Flattening Yield Curve: How Stocks React
Stocks generally move up unless there’s economic strife. Therefore, it’s not surprising to hear that stocks go up when the yield curve flattens at the end of the cycle. Sometimes stocks move up a lot because at the end of bubbles there is often a blow off top where incredible returns occur.
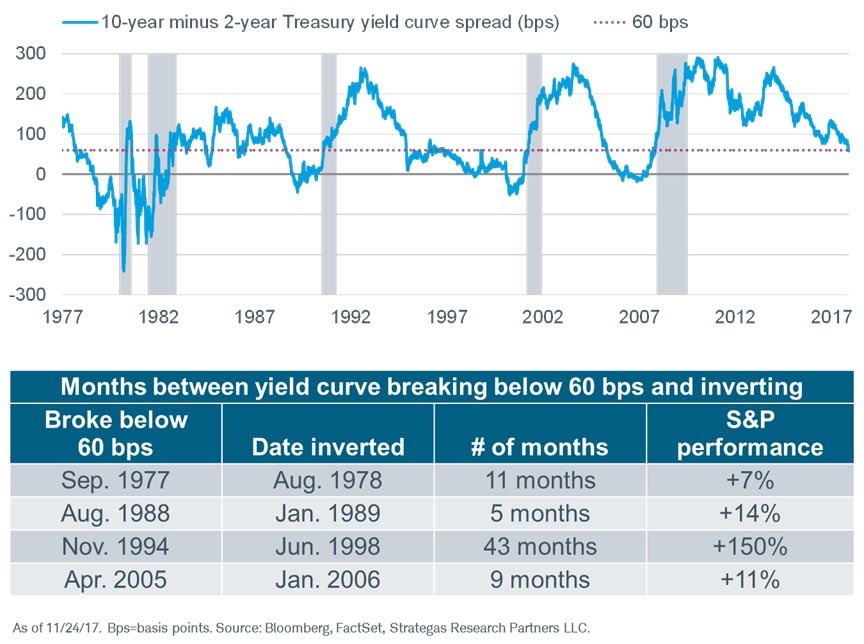
The chart below looks at the 10 year- 2 year spread. In the last 4 cycles, the curve inverted 17 months after getting to 60 basis points on average. The average annualized gain is 24.44% during the flattening period. That gain is boosted by the 1990s performance which shows how blow off tops can occur. It can be advantageous to buy stocks before a recession if you know when to get out.
Great Returns In Flattening Periods
Where To Put Your Money During Flattening Yield Curve
The past 4 times the 10 year minus the two year fell below 60 basis points, buying stocks was good. However, the question remains “how do you allocate your portfolio?”
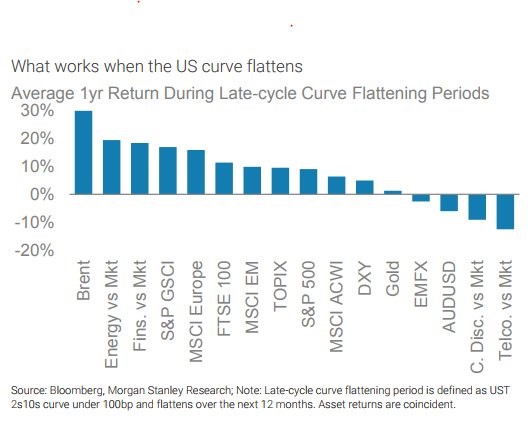
The chart below helps answer that question. As you can see, oil does well and so does the financial and energy sectors.
Best Places To Invest When Flattening
Energy and oil do well because inflation usually increases at the end of the cycle, meaning oil prices are going up along with the other commodities. Financials do well because the Fed fights inflation with higher rates. Higher rates mean higher net interest margins. The telecom sector under performs because rising bond yields mean investors don’t need to buy high yielding telecom stocks, which act as bond-like instruments, to get the returns they crave. Consumer discretionary under performs because input costs go up, squeezing margins. Inflation also hurts the consumer’s purchasing power.
The table below has different returns for the flattening period than the chart in the middle of this article because it uses the 6 month bill as the short end. This chart also has energy doing well and consumer discretionary impacted poorly. Utilities do poorly for the same reason as telecom stocks. They have high dividend yields which face greater competition from fixed income investments when bond yields go up. Tech was involved in the blow off top in the 1990s, but other than that it has had middling performance in the flattening periods. In this cycle, Google and Facebook dominate the sector. They may act in tune with consumer discretionary stocks because they are advertisers.
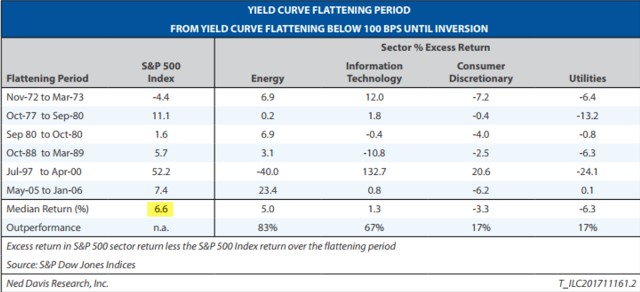
Buy Energy, Sell Utilities & Consumer Discretionary In Flattening Periods
Conclusion
This is just one factor among the many you should look at when determining the point in the business cycle and which weightings to have in your portfolio. For example, you would want to research how the GOP tax plan will affect each sector before deciding. That being said, this article is a great starting point to see the effects a flattening yield curve have on certain assets. Be sure to check the yield curve weekly to see if the situation changes. Good economic reports or a dovish Fed not intent on raising rates further could cause it the yield curve to steepen.
Have comments? Join the conversation on Twitter.
Disclaimer: The content on this site is for general informational and entertainment purposes only and should not be construed as financial advice. You agree that any decision you make will be based upon an independent investigation by a certified professional. Please read full disclaimer and privacy policy before reading any of our content.


