UPFINA's Mission: The pursuit of truth in finance and economics to form an unbiased view of current events in order to understand human action, its causes and effects. Read about us and our mission here.
Reading Time: 6 minutes
Some critics of the Federal Reserve said that it wouldn’t unwind the balance sheet. Their criticism got louder after the first few months of the unwind at the end of 2017 because the balance sheet size went up and down without a discernibly clear downtrend. However, as evidenced in the chart below, with the unwind increasing to $20 billion per month in January, the balance sheet has started to shrink at a quicker pace. January was a big month for global QE tapering because of this change and the €30 billion euros in tapering by the ECB.
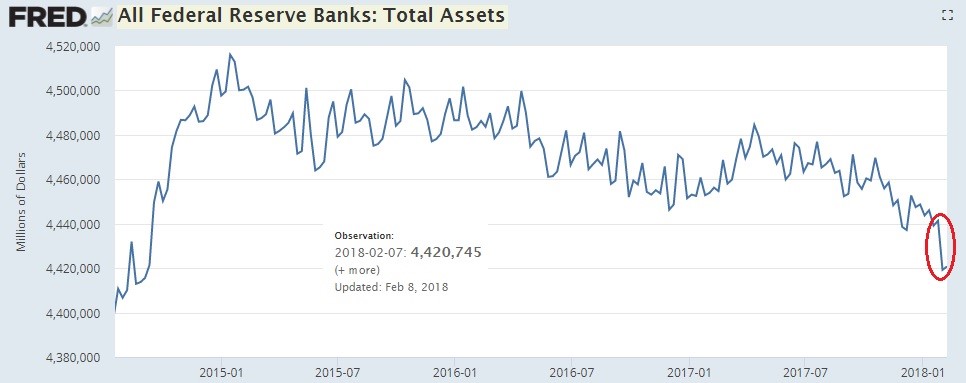
Fed Balance Shrinks Sharply In January
January was a great month for central bankers because they started to return policy to normalcy as we suggested in November, in spite of which asset prices continued to increase. Stocks spiked so rapidly, it made even the most ardent critics of QE step back in awe; they said tapering would lead to a crash in asset prices, but they skyrocketed instead. The rally was boosted by the most optimistic retail investors ever, a potential warning indicative of the quality of investors who are chasing all-time high valuations. Retail investors loved the lack of volatility and great returns in 2017; they have clearly forgotten the 2008 financial crisis. We thought there could be a risk of increased volatility in stocks because of QE tapering. This was avoided in January, but came into play in February.
Saying there will be more volatility in 2018 isn’t a stretch because 2017 was very quiet. We previously reviewed in detail what has historically happened to markets following years of extremely low volatility.
The average performance of years following low volatility isn’t great as the S&P 500 increases only 5% and the max drawdown average is 12%. The S&P 500’s average return in the past 90 years is 9.8%, so this is a big step down. This doesn’t come close to guaranteeing what 2018 holds. You need to do your usual economic analysis along with individual company research before making any portfolio decisions.
It’s probably wrong to expect tapering to lead to an immediate crash because that assumes monetary policy is the only thing that affects stocks. That’s myopic thinking as stocks are affected by economic momentum, geopolitical risks, valuations, and fiscal policy. However, saying the tapering will have no effect on stocks is delusional.
Bearish Case For QE Tapering
The graphic below shows the web of effects QE could be having on financial markets.
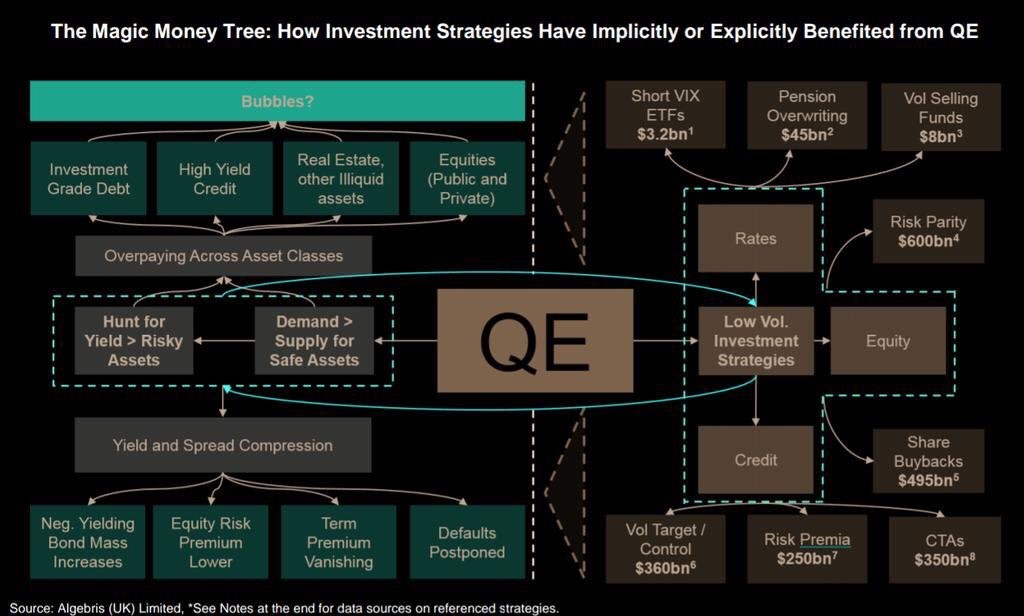
The Web Of QE
The box which shows the $3.2 billion in short VIX ETFs ended up being spot on as there was a huge collapse in those funds in early February during the correction. One of the more recent discussions on Wall Street is about the risk parity funds which are also mentioned in this graphic. Clearly, $600 billion in investment capital is a bigger deal than $3.2 billion. Risk parity is an alternative portfolio allocation model which differs from the standard 60% stocks and 40% bonds model. The standard model increases the stock portion when the investor wants to increase risk and increases the bond portion when the investor wants to avoid risk.
Risk parity means each portion of the portfolio has the same risk level. There are risk parity funds with a targeted volatility level. This is the aspect affected by QE. If you believe QE suppresses stock volatility, then the entire risk parity strategy of targeting a certain volatility level can be turned on its head when the market’s overall volatility increases. Investors willing to take a high level of risk will have their entire portfolio in flux without a safety cushion of bonds in times of extreme volatility. These volatile periods could be created by the strategies we’re discussing since the short VIX trade actually caused stocks to plummet quickly.
Poor Timing: Deficits & Unwind
The government deficits are projected to increase as the Congress recently made a deal to increase government spending by over $300 billion in the next two years, meaning there will be a $1.15 trillion deficit in 2019. It’s not fiscally responsible to combine tax cuts with increases in government spending. These are extremely high deficits for an economy with near full employment. If the economy went into a recession, the deficits would hit new record highs. Such high deficits are especially risky with the Fed unwinding its balance sheet. As you can see from the chart below, the combined tapering and extra deficits will increase the supply of treasuries by near a record. This could increase yields. Clearly, the supply is only one side of the trade. The demand for this new paper will determine where yields go.
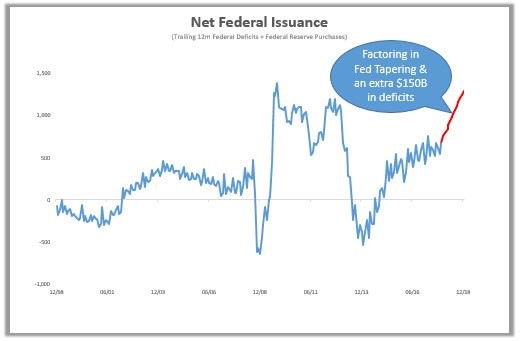
Painful Combination Of Deficits & Tapering
Will Higher Interest Rates Cause A Crash?
We previously discussed how the 10 year yield reaching 3.5% could hurt valuations. Some investors changed their minds after the February correction because stocks fell when the 10 year yield hit 2.7%. It’s scary for equity investors because the increased supply in treasuries could increase yields. The charts below are calming as they show two instances where the 10 year yield increases led to only temporary spikes in volatility: the 2013 taper tantrum and the 1994 tightening cycle where there was a surprise rate hike.
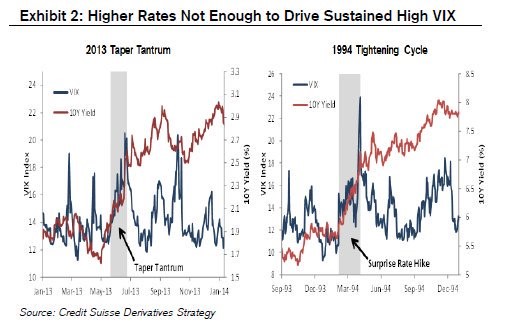
Increasing Yields Only Cause Temporary VIX Spike
As you can see, there was an area where volatility increased, but then it died down. This could occur in 2018 as the 10 year yield is still far below 3.5%.
Unusual New Relationship Between Loans & Rates
As you can see from the chart below, the Fed funds rate is increasing while the loans and leases growth from all commercial banks slows.
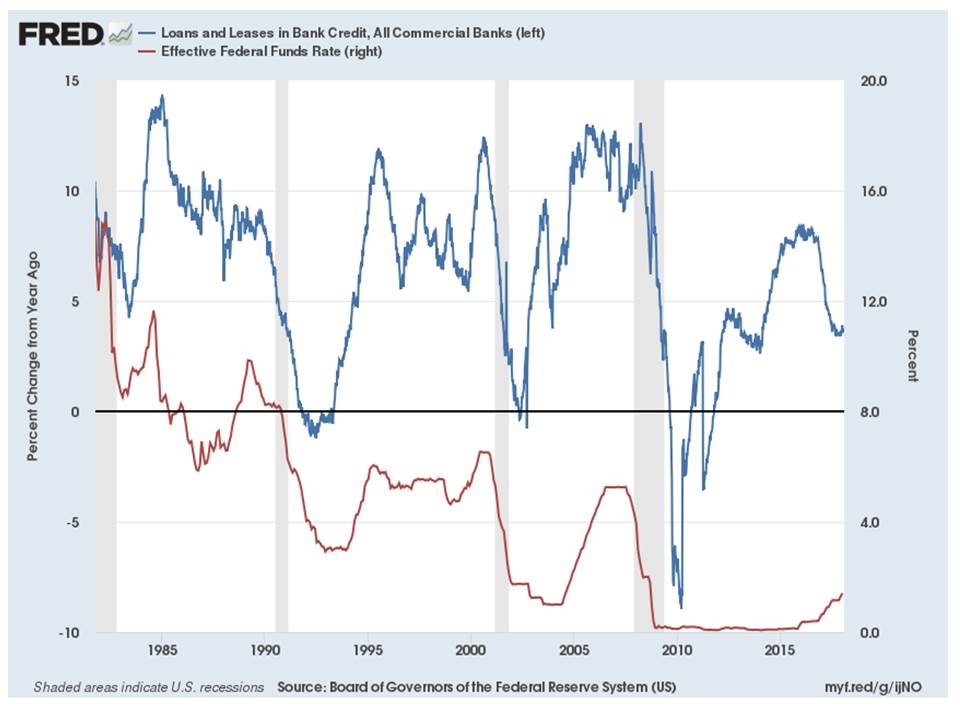
Rates Up Loan Growth Down?
This is an unusual combination. Loan growth usually accelerates during expansions which is when the Fed hikes rates. The economy is relatively stable which means the loan growth might go higher but the fact that such minimal Fed rate increases have coincided with a noticeable decline in lending is reason for concern, suggesting that the economy is in fact slowing down.
As we pointed out recently:
…the commercial and industrial loan growth is 1.1%. That growth rate usually implies a recession is near or has recently occurred.
Loosening Standards
One of the best indicators of the future economy is the banks’ lending standards. The chart below shows lending standards are still loose for large and middle market firms.
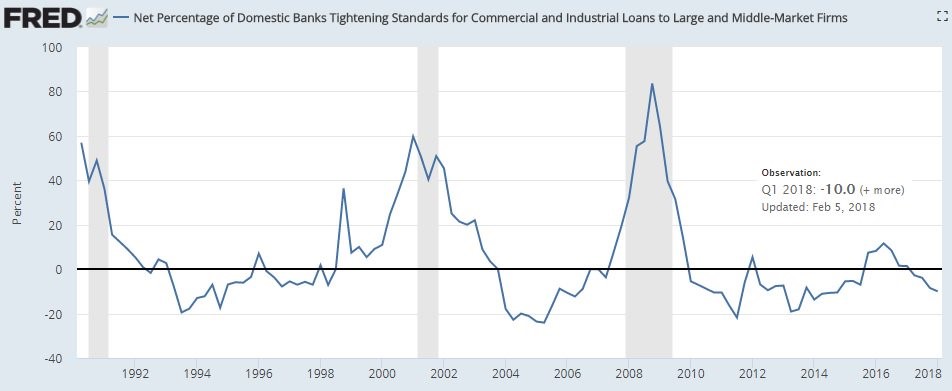
Loose Lending Standards
While this metric doesn’t include small firms, it would seem the decelerating loan growth in the chart above is from a lack of demand, rather than tight standards. A strengthening economy should increase loan growth especially if standards are loose. Once the indicator goes above zero we’ll be on recession watch. For now, it doesn’t look like a recession will occur in 2018. As you can see by the indicator in the chart going above 0, the US economy was on the precipice of a recession in 2016 when central banks saved it, something that was not widely discussed in the news.
Conclusion
At first, it looked like anyone calling for an increase in volatility in 2018 because of QE tapering was foolish. With the correction in February, it begs the question if the change in central bank policies was partially responsible for the increase in volatility. This will get even more interesting in the next 18 months as the total balance sheet net change from the G3 central banks (Fed, ECB, BOJ) goes from positive to negative. This could cause even more volatility, making the February correction look tiny in comparison.
As we mentioned previously:
…we may see a recession much sooner than the market anticipates. During the latter innings of a business cycle its prudent to change your portfolio risk allocations. The same investments that were great during the beginning of the bull market, may not be the best to hold during the late period of the cycle.
Have comments? Join the conversation on Twitter.
Disclaimer: The content on this site is for general informational and entertainment purposes only and should not be construed as financial advice. You agree that any decision you make will be based upon an independent investigation by a certified professional. Please read full disclaimer and privacy policy before reading any of our content.


