UPFINA's Mission: The pursuit of truth in finance and economics to form an unbiased view of current events in order to understand human action, its causes and effects. Read about us and our mission here.
Reading Time: 5 minutes
We often discuss the yield curve as a time piece to measure when the next recession will occur. However, we have never mentioned the exact time the inversion is expected to happen. The chart below shows the forward market is pricing in an inversion in 2023.
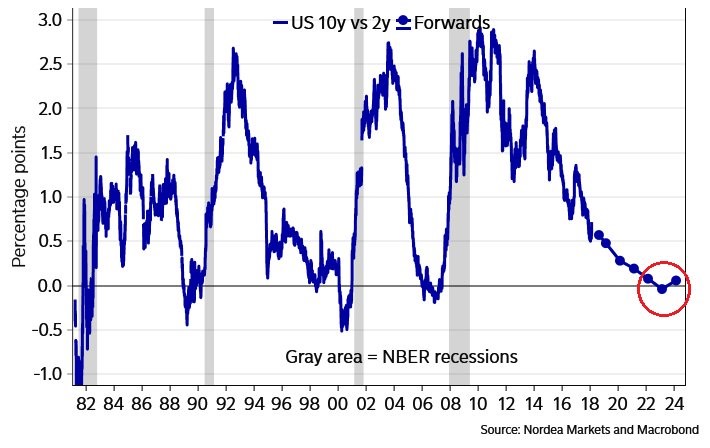
Forward Yield Curve
This tells you what the current market expects. Don’t take these expectations to mean this is a certainty; markets often do a terrible job of forecasting future events. For example, the stock market hit new highs in 2007 which was a year before the financial crisis. Based on current market expectations, if an inversion happens in 2023, that could suggest a recession will occur either in 2024 or 2025. Therefore, if you’re expecting a recession sooner than that, you have a contrarian opinion. Furthermore, if you think the yield curve will invert before 2023, you also are a contrarian.
Some would say expecting this expansion to be the longest ever by far is a level of complacency that is usually relegated to governing bodies’ forecasts like that of the Fed or the IMF. On the other hand, this chart also maps out how the yield curve doesn’t have to invert right away. If you extrapolated the last two cycles onto this cycle, you would’ve been way off because it hasn’t gone down in a straight line. In other words, the hour glass time piece has occasionally been flipped on its head, adding a few more minutes. As we have detailed previously, this is the third longest expansion since 1854.
Earnings Returns In A Rare Era
With the realized volatility in stocks so low in 2017 and this bull run being one of the largest and longest in history, investors often seek to examine how overdone this rally is. The Shiller PE reached its highest point outside of the tech bubble. As you can see in the table below, the real returns in the 2010s aren’t that unusual when compared with previous cycles.
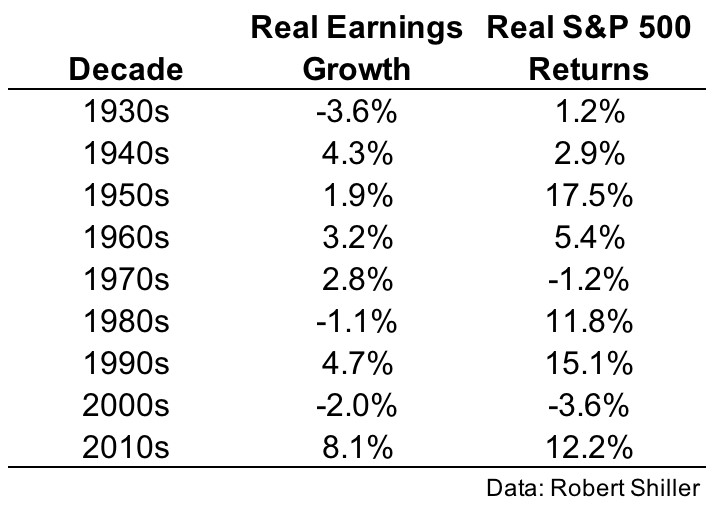
Real Earnings Growth Hits A Record For Performance By Decade
There aren’t that many data points to consider, but the current returns are the third highest for a decade. The 2010s real returns are almost double the average of the previous decades as they are helped by the low inflation rate and the lack of a bear market. The unusual part of this table is the real earnings growth. The 8.1% growth per year is by far the highest ever seen. The previous height was the 1990s which had 4.7% growth.
The earnings growth in the 2010s has been helped by low inflation and high margins. The Shiller PE doesn’t buy into the notion that margins will be elevated for long, so it predicts stocks will have low long-term returns. This information completely destroys the notion that the current stock market doesn’t deserve the high multiples of the 1990s because of its low GDP growth. You don’t buy stocks by looking at GDP; you look at future earnings to come up with a fair value. The higher earnings growth rate in the 2010s justifies the high multiple regardless of how low GDP growth is. Keep in mind, when we say that growth justifies the multiple, we aren’t saying stocks should be at these elevated levels. Rather, we are saying an earnings correction is needed to bring stocks in line because forward estimates show stocks to look like decent investments.
Forward estimates are almost always too optimistic, but optimism is an understatement for the next couple of years. As you can see, the gross margin percentage and EBITDA margin percentage are expected to reach new heights.
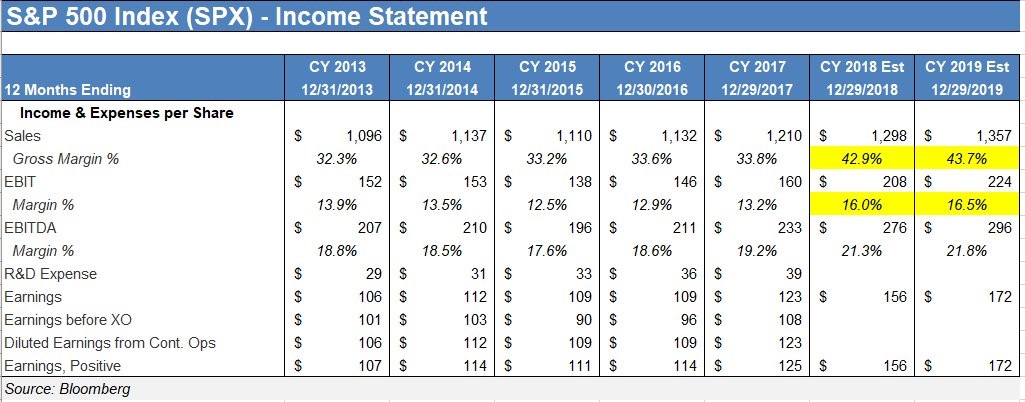
Elevated Margins Expected In 2018 & 2019
This euphoria in the estimates is based on the tax cut and a renewed global growth acceleration. If the 2019 S&P 500 estimate of $172 per share is reached, stocks will have been cheap at current levels. As you can tell, this time is different. Rather than investors paying extreme forward multiples this cycle (as in the 1990s), the analysts are making euphoric projections.
The current forward PE of 18 is the highest since the tech bubble, but in that period the forward PE was much higher as it got near 27. This time profit margins are expected to reach records. The main question investors are asking is if the high margins, boosted by tech growing its earnings share, are sustainable. The threat of government fines and breakups could be the principal concern for the large tech names. If margins aren’t maintained or grow, stock valuations are extremely high when you look at the price to sales ratio. The P/S is almost at the exact level the tech bubble peaked at.
End Of QE On The Horizon
The stock market had low volatility in 2017. It was a year where global quantitative easing started to slow, but was still elevated. Quantifying the effect of QE is difficult which is why all we can say about 2018 is it might have more corrections. Traditionally, it’s though that the economy drives the market, but some investors like George Soros, believe in the reflexivity theory which states stocks can drive the economy. This is a reasonable conclusion to make given the leverage inherent in the financial system. A panic in the stock market would worsen the business climate. That creates a virtuous cycle whereby the weak business climate causes stocks to fall further.
The main central bank which is changing its policy in 2018 is the ECB. It cut its bond buying in half to €30 billion per month in January. By the end of the year, the buying will be over. The chart below shows the early changes in the weights of the tapered purchases.
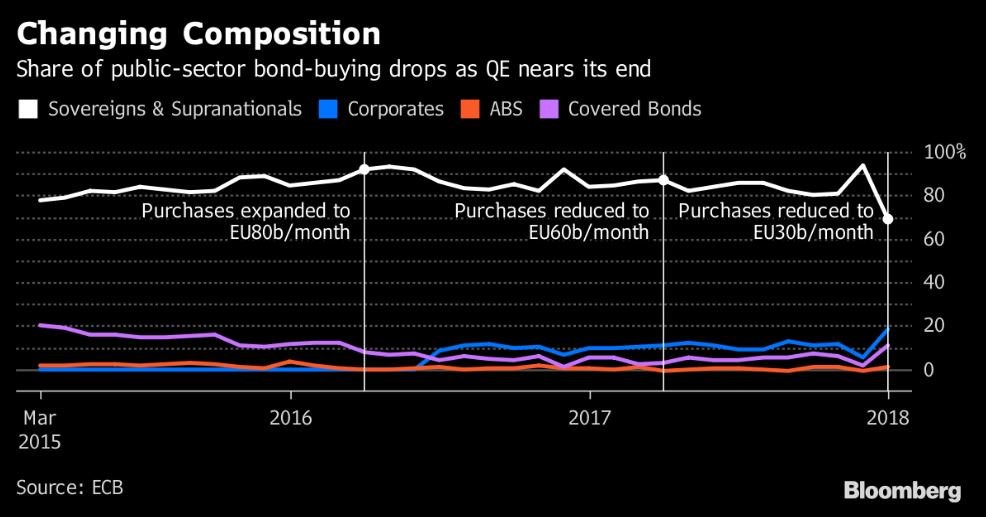
ECB Switches To More Corporate Bonds
The government and supranational debt buying fell to 69% in January and the corporate sector bonds increased to 19%. The ECB might feel it is getting more bang for its buck with the corporate purchases. As you can see, the ECB is being dragged kicking and screaming from this QE program.
Conclusion
We discussed three of the biggest risks to the stock market in 2018, namely the end of the business cycle, which will be signaled by a bond yield inversion, high valuations which are supported by record margin projections, and the end of the ECB’s bond buying program. These factors, among others, suggest that we may see a recession much sooner than the market anticipates. During the latter innings of a business cycle its prudent to change your portfolio risk allocations. The same investments that were great during the beginning of the bull market, may not be the best to hold during the late period of the cycle.
Have comments? Join the conversation on Twitter.
Disclaimer: The content on this site is for general informational and entertainment purposes only and should not be construed as financial advice. You agree that any decision you make will be based upon an independent investigation by a certified professional. Please read full disclaimer and privacy policy before reading any of our content.


