UPFINA's Mission: The pursuit of truth in finance and economics to form an unbiased view of current events in order to understand human action, its causes and effects. Read about us and our mission here.
Reading Time: 4 minutes
There will always be experts predicting where the economy is going. It can become impossible to make sense of it all if you are basing your opinion on what the top investors are saying. This is because at any time there are many intelligent investors on both sides of the spectrum. It’s critical to listen to them, but make up your own mind. To make up your own mind, you need to know some of the basic indicators to look for to determine if a recession is coming soon. Some investors have the philosophy that you should always have money invested, but a crash in the stock market right before your retirement can wreak havoc on your ability to live comfortably after retirement. Therefore, these indicators are useful and worth following.
One of the most important economic indicators is the yield spread. This is the difference between the yields on treasury bonds with short maturities and long maturity dates. Usually long-term bonds have higher interest rates than short term bonds. This is an upward sloping yield curve because each point on the curve which has a longer maturity date has a higher yield to compensate for the extra time held. The larger the difference in yields, the steeper the yield curve. The chart below shows the difference between the 10-year yield and the 3-month yield.

Another popular spread to look at is the 2-year yield versus the 10-year yield. As you can see, the yield spread is large after recessions as the economy is strong.
An inverted yield curve is when the spread is negative. As you can see in the chart, before every recession in the past 60 years, the spread has narrowed close to zero or below it. The Federal Reserve controls the short-term bond market through the Fed Funds rate. When the Fed raises rates, it flattens the yield curve because the short end yields rise. The Fed raises rates to combat inflation. Higher interest rates promote savings as investors put their money in CDs instead of chasing goods and services prices higher. Hiking rates makes it more expensive to get a loan which crimps economic growth. When investors foresee economic weakness, they buy long term treasury bonds to lock in those high interest rates because they see the Fed cutting rates in the future. Once the Fed cuts rates, the curve steepens again and the economy rebounds.
The yield spread is one of the best recession indicators. Some economists believe the yield curve’s record will be marred by the next cycle because the Fed manipulated long term treasury yields by buying them in its quantitative easing program. However, even after the Fed announced the plan to unwind the balance sheet, meaning letting the bonds it owns expire, long term treasury yields fell, indicating that the strategy of investors buying long-term bonds when they see economic weakness is still in play.
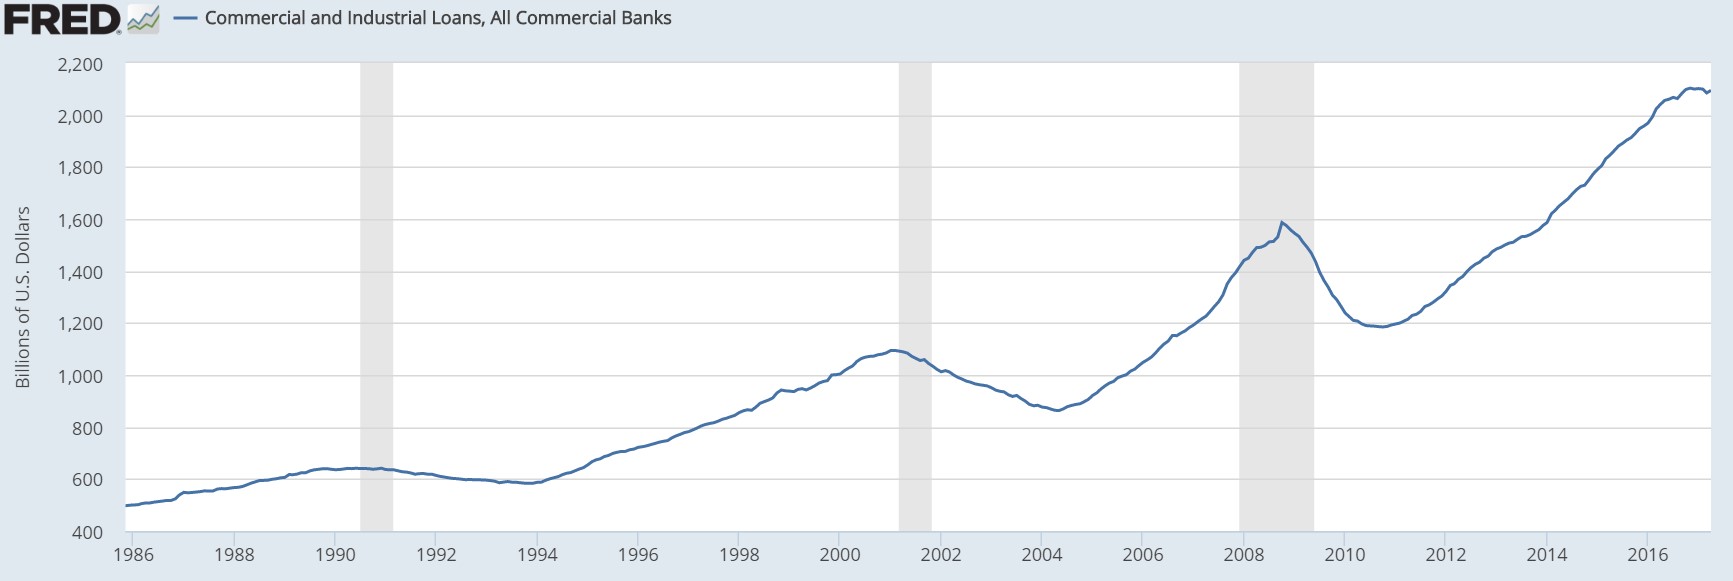
The second recession indicator is C&I lending growth. C&I stands for Commercial and Industrial. Economic growth periods and recessions are driven by the credit cycle because demographic changes and productivity growth changes are slow. When excess debt is issued, businesses can invest in new initiatives and consumers can spend more money. This allows the economy to grow faster than its long-term average. Debt borrows from future growth. Eventually the debt gets too large and banks stop giving out loans because defaults are rising. This causes a deleveraging which means businesses and consumers spend less so they can to save money to pay off debt. Saving money means future growth will be strong because it will increase when the money is spent.
C&I loan growth is a great indicator of the credit cycle because when loan growth is robust, it means the economy is adding debt and growing. When growth is negative, it means lending standards are rising as capital isn’t accessible. The chart below shows C&I lending along with the shaded bars which are recessions. C&I lending peaked in June 1990 which was one month before the recession started. In February 2001, it again peaked one month before the recession. During the last cycle, lending peaked in October 2008 which was 10 months after the recession started. The rule of thumb is a recession is coming, happening, or just happened when C&I lending growth is negative. The only time that didn’t happen was the peak in November 2016.
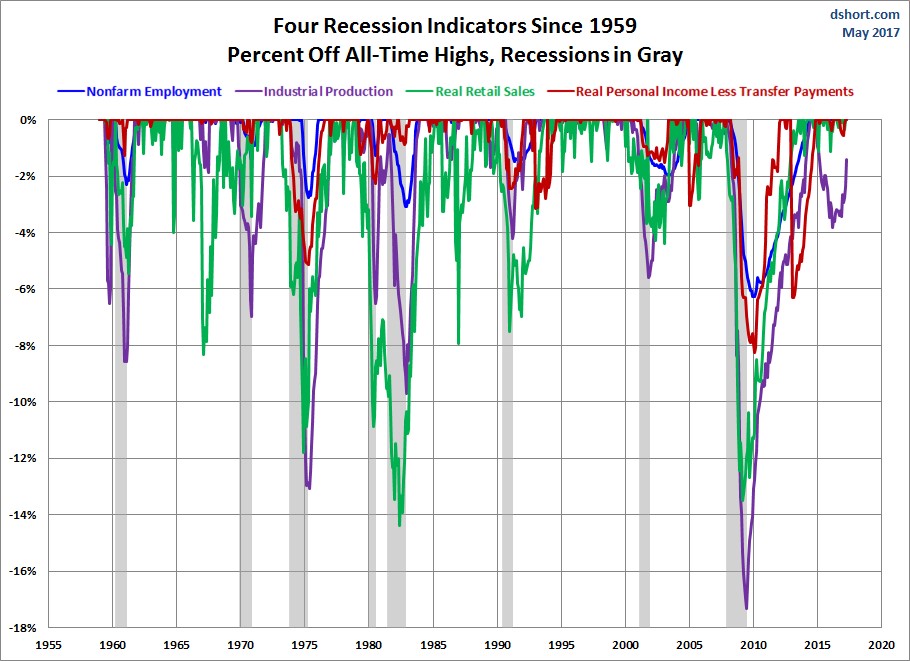
The chart below shows 4 more indicators which are employment, industrial production, real retail sales (meaning without inflation), and real personal income minus transfer payments (government spending program like food stamps). The chart below shows the declines in these indicators relative to the shaded bars which are recessions. The Fed’s decisions, the yield curve, and C&I lending are indicators which project how the indicators below will do. The yield curve is a leading indicator because it inverts before recessions. Employment, retail sales, and real incomes are lagging indicators because firms don’t start cutting their workforce until the economy gets bad. These layoffs reduce incomes which limits retail spending. Tightening C&I lending standards precede industrial production weakness because not being able to get a loan crimps business growth.
As a rule of thumb, when a recession is coming, investors buy long term treasury bonds because they are safe. The low interest rates aren’t a big deal because inflation is low. Stocks fall during recessions, but the ones with high dividend yields which can be paid outperform because they provide a security blanket. The best sectors to buy are utilities and consumer discretionary because they have consistent businesses. The sectors to avoid are technology and consumer discretionary because they are more sensitive to the economy. Even though gold is thought of as a safe haven, it fell over 20% during the financial crisis in 2008, only to quickly rally and reach new all-time highs. Most commodities fell as the winner was the 30-year bond. Not all recessions provide the same market action, so it’s critical to avoid investing blindly without understanding the circumstances. Asset performance will depend on the cause of the recession and its severity.
Have comments? Join the conversation on Twitter.
Disclaimer: The content on this site is for general informational and entertainment purposes only and should not be construed as financial advice. You agree that any decision you make will be based upon an independent investigation by a certified professional. Please read full disclaimer and privacy policy before reading any of our content.


