UPFINA's Mission: The pursuit of truth in finance and economics to form an unbiased view of current events in order to understand human action, its causes and effects. Read about us and our mission here.
Reading Time: 5 minutes
The stock market sold off 10% in early February, leaving some investors panicked as they hadn’t seen a selloff in well over a year. Stocks were in a record streak without a 3% and 5% decline. Stock market declines of at least 10% happen every 357 trading days, so this decline is normal. However, just because it is a correction, which are important to make bull markets stronger and more resilient, this might not be a “healthy correction”. Figuring out the reason for the decline helps investors forecast where the market is headed. The financial media’s narrative comes from asking traders, many of whom didn’t forecast the correction in the first place. Everyone has an opinion, so its important to weed out the facts from the noise.
Volatility Index Blowup
As we mentioned, the stock market hadn’t had a meaningful decline in over a year. This meant investors could make money shorting volatility. This is a more complex bet than simply buying stocks; it also is a bullish trade. This trade ended up blowing up in these speculators’ faces as it unwound forcing stocks to sell off. There were inklings that something was amiss earlier in the year because even as stocks rose, the VIX volatility index went up. The forced selling in these short volatility instrument caused put buying to occur which sent the market lower, creating a panic self reinforcing feedback loop. The two ETNs which crashed were the XIV and the SVXY which fell 94.32% and 89.94% in three days. These crashes caused about $3 billion losses. As you can see from the chart below, the assets under management for the leveraged ETPs went from about $4.5 billion to $1 billion in a few days.
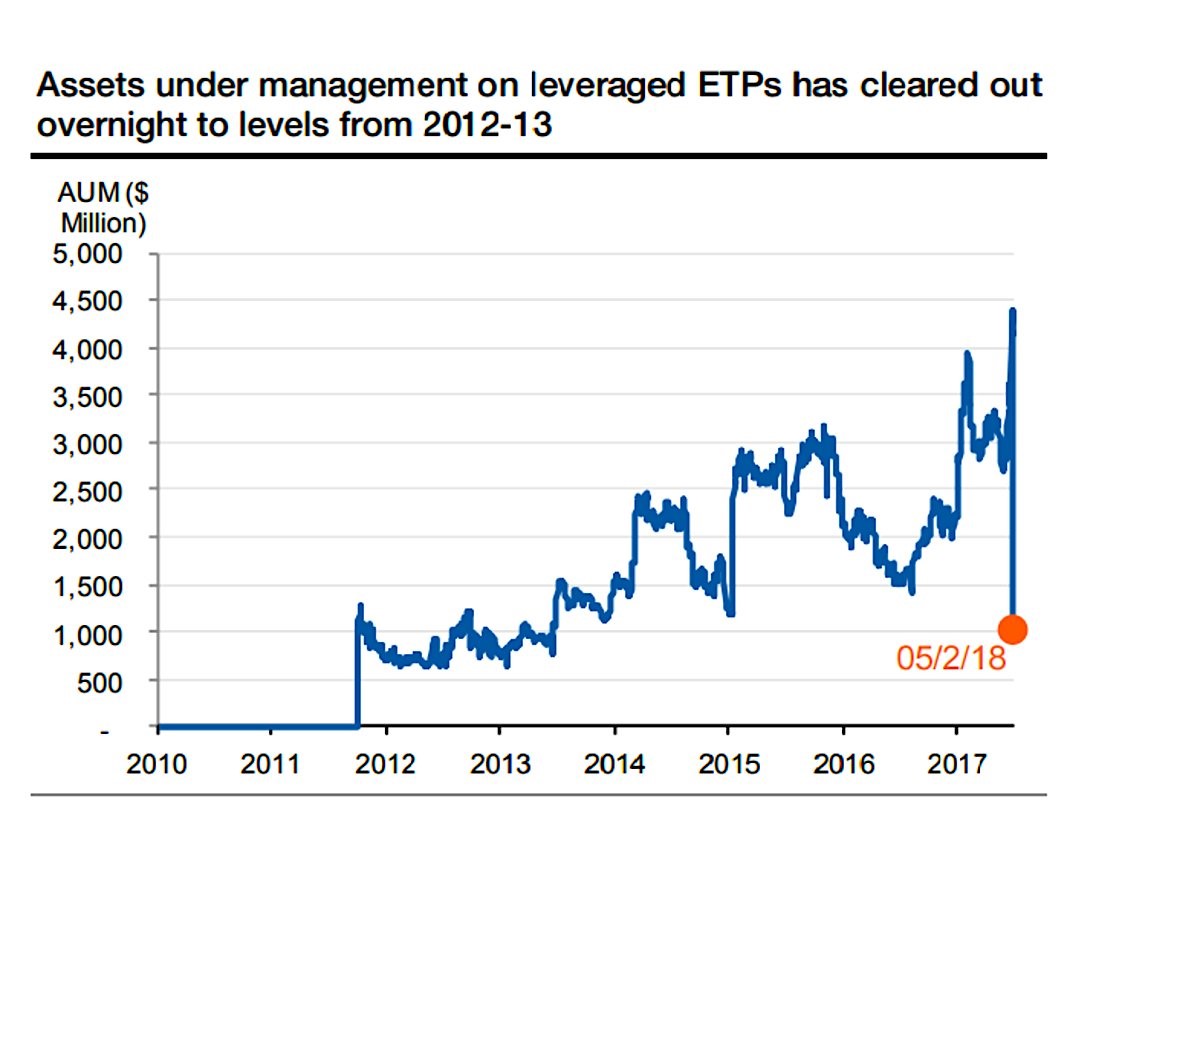
Leveraged ETPs Assets Under Management Cratered
Rising Interest Rates Caused The Decline
There is another view that the the cause of the initial decline in stocks is unrelated to this debacle with the leveraged exchange traded products. Some say stocks fell because interest rates rose. The catalyst of rate increases is another controversial issue. Many traders point to the January labor report as the catalyst for rate increases. In the report, it showed average hourly earnings were up 2.9%. As you can see from the chart below, this is the highest wage growth since June 2009. However, this is only part of the story. Workers get paid their wage times the amount they work, so take home pay increases only go up if the work week is a certain length.
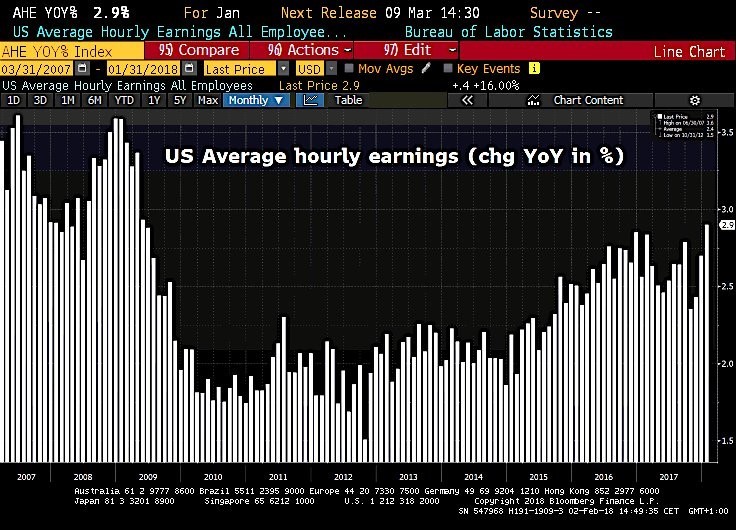
Average Hourly Earnings Growth Fastest Since June 2009
In January, the work week fell from 34.5 hours to 34.3 hours. This means weekly earnings growth fell from 2.9% to 2.6%. The money transferred from employers to employees was middling. Therefore, it’s debatable if inflation expectations and yields should go up based on that report. One point which helps the case of those claiming yields rose because of this report is that the initially reported 2.9% hourly wage growth in September 2017 probably didn’t cause the 10 year yield to rise because that was the report following the hurricanes which initially showed there were 33,000 jobs lost.
As usual, the Fed is involved with market corrections. As you can see from the table below, the chance of a March rate hike increased from 33% in September to 83% in February.
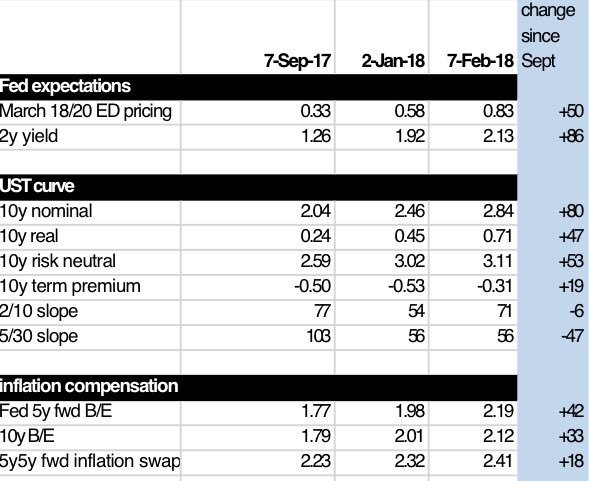
Market Expects More Hawkish Fed
The rate hike odds were boosted by the optimism about the economy. Investors increased their inflation expectations by 42 basis points in the past 5 months, as you can see from the line which shows 5 year breakeven inflation. This is all about the market’s pricing of Fed policy rather than forward guidance because the Fed has been relatively quiet in the past few months as the transition from a Yellen led Fed to a Powell led Fed was made. Essentially, stocks caused themselves to selloff because their initial optimism pushed up the Fed funds futures.
Interest Rates Didn’t Cause The Decline
As we mentioned, there are some investors who don’t believe the increase in bond yields caused the recent correction. In a previous article, we mentioned that the 10 year bond yield needed to go to 3.5% before it started hurting stocks. In most previous market cycles, it took until 5% to hurt stocks, but we’re starting from lower yields. These investors point to the chart below which shows that the 10 year yield was correlated with stocks until recently.
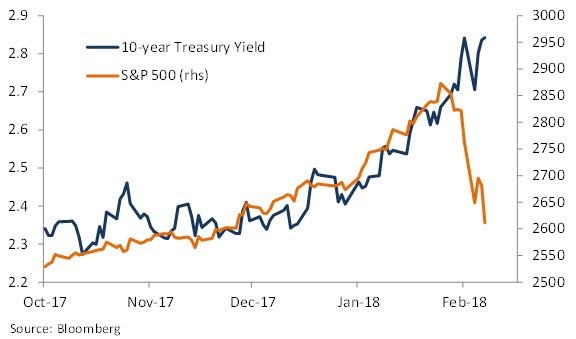
10 Year Yield & Stocks Diverge
It’s weird to think stocks didn’t care about rates in January, but then started caring about them in February. Investors in the past few months could have foresaw yields increasing this high, yet they didn’t sell their stocks.
The theory with yields is the same as inflation, namely rising yields and inflation mean growth is looking strong, but at a certain point the economy overheats which catalyzes a recession as we discussed here and here. If you believe the 2.7% threshold on the 10 year bond yield is the new point which hurts stocks, then you should be bearish because global growth has been pushing commodities up and the 4.1% unemployment rate in America is pushing up wage growth. These factors push up inflation and the 10 year bond yield.
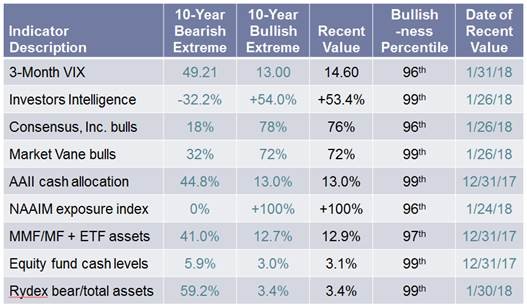
Investors Were Simply Euphoric
The easy answer to why stocks corrected also might be the best answer. Investors were too optimistic. They bid up stocks relentlessly which was unsustainable, in what was termed a blow off rally. It was the exact opposite of January 2016. Stocks went up so much Bank of America raised its year end price target after just a few weeks into the year. The table below gives a great summary of how euphoric investors were at the end of January. The cash allocation was so low it was in the 99th percentile of bullishness. The investors intelligence index was so optimistic that it was also in the 99th percentile of bullishness.
Sentiment Reversal Caused The Correction
Conclusion
If investors are worried about inflation and interest rates, this is a major problem for the Fed because it wants to raise rates to have room to cut them in the next recession. If the 3 hikes in 2018 cause a recession in 2019, there will only be 225 basis points to cut before it reaches zero. It’s important to realize that even though the economy is strong in Q1 2018, that doesn’t mean there won’t be a recession in the next 1-2 years. Often declines in asset prices catalyze recessions. The tech bust in 2000 led to a recession in 2001 and the decline in home values starting in 2006 led to a recession in 2007-2009. As we pointed out a few days ago, the market forward pricing anticipated a recession to only arrive in the mid 2020s, which may be too optimistic. Reality seems to be setting in whether its for the right or wrong reasons.
Have comments? Join the conversation on Twitter.
Disclaimer: The content on this site is for general informational and entertainment purposes only and should not be construed as financial advice. You agree that any decision you make will be based upon an independent investigation by a certified professional. Please read full disclaimer and privacy policy before reading any of our content.


