UPFINA's Mission: The pursuit of truth in finance and economics to form an unbiased view of current events in order to understand human action, its causes and effects. Read about us and our mission here.
Reading Time: 5 minutes
Whenever there’s an indicator which has a great track record, there are investors who disagree with it, providing logical criticism. It’s important to balance the criticism with the indicator, which has a great track record, to determine which makes the best points objectively. This isn’t a clear process because great minds can disagree. If there was a clear formula which provided you with a confident forecast of the market, there wouldn’t be a way to make money. The analytical process of studying data is the uncertain part which separates the good investors from the bad.
Whenever the yield curve flattens, there are always critics who blame the Fed for manipulating the curve with QE thus arguing that this makes the indicator invalid. It’s interesting to see that the bulls and the bears swap on this issue. Usually, the bulls say the balance sheet expansion didn’t cause the stock market rally. They correctly point to the past 2 years of the rally which occurred while the balance sheet has stabilized. If the market discounts, the future, why would the current guidance for an unwind not cause a sell off? The bears say the international QE, which looks to be slowing down in 2018, is causing the recent rally in stocks. It seems that some bulls and bears blame QE when the market doesn’t go their way.
The yield curve doesn’t forecast a recession until it inverts, but whenever it flattens investors get weary about the time left in the expansion. The chart below discounts the notion that the yield curve is manipulated.
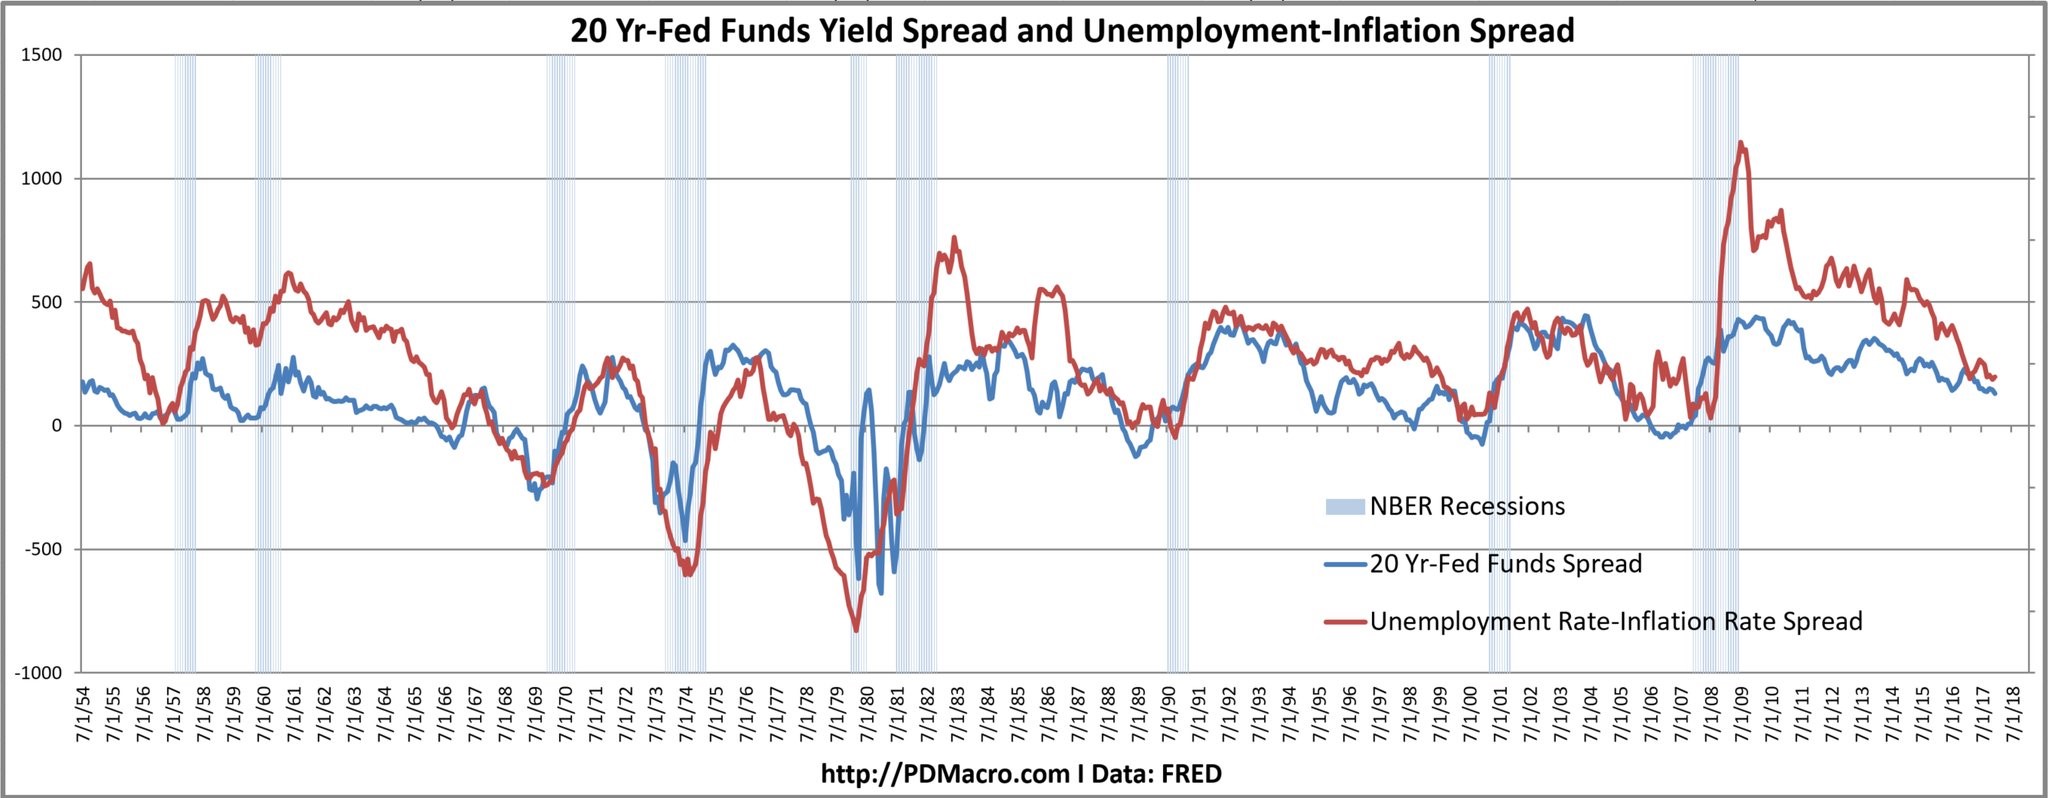
Regardless Of QE, The Yield Curve Is Still A Relevant Economic Forecasting Tool
As you can see, it shows the difference between the Fed funds rate and the 20 year bond yield compared with the difference between the unemployment rate and the inflation rate. Both have been correlated and have great track records at predicting where the economy is in the business cycle. Their correlation has remained consistent this cycle. It makes sense that the unemployment to inflation ratio predicts recessions because a low unemployment rate and a high inflation rate portend recessions. That’s why the worst time to buy stocks is when the unemployment rate is low and rising.
Inflation Signals Late Cycle
The quicker inflation increases, the greater the chance the Fed will raise rates which perpetuates the end of the business cycle. If inflation continues to increase, 2018 could be comparable to 2007 in the previous cycle. In that year, oil spiked which took a tole on economic growth. That’s not to necessarily in of itself to say the next recession will be as bad as 2008 because the mortgage crisis amplified that recession. As you can see in the chart below, the regional Fed surveys are showing inflation is nearing the highest level since this expansion started.
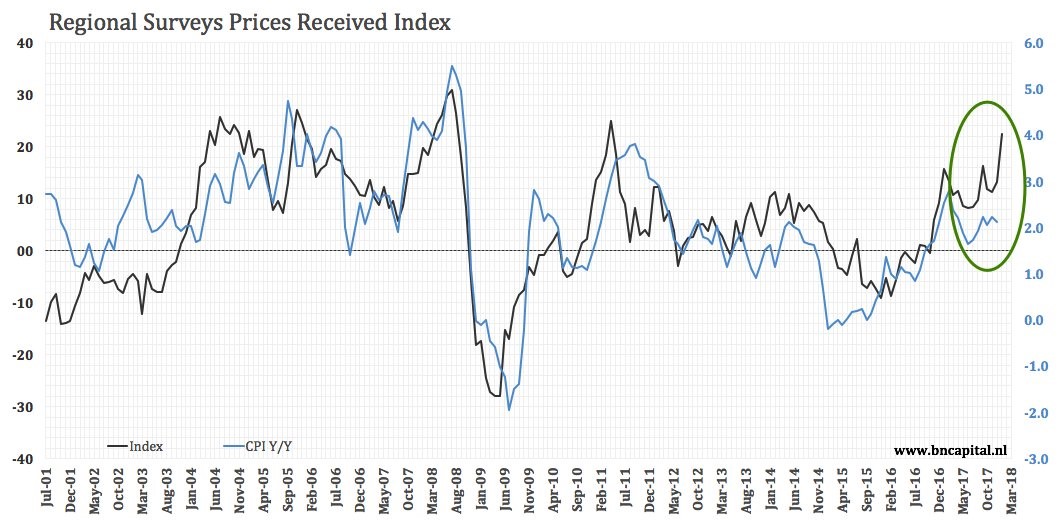
Regional Fed Surveys Show Inflation Picking Up
If the regional Feds’ prices received index forecasts inflation, 2018 could be like 2007. However, as you can see, there has been a divergence in the actual inflation data as measured by the CPI and the regional Fed surveys. We’ll need to wait to see which metric is telling the truth.
How Yields Affect Stocks
Usually it takes until the 10 year treasury bond yield gets to 5% for stocks to start being hurt by the increases in yields. However, this cycle has seen much lower real GDP growth, lower inflation, and high valuations. As a result of this cycle’s differences, the implied inflection point where stocks will be hurt by rising yields is 3.5%. Some believe in the TINA trade which is ‘there is no alternative.’ This means there’s no alternative to buying stocks because bond yields are low. That trade is ending as the 2 year bond now has a higher yield than the S&P 500 dividend yield. The 10 year CAPE multiple shows stocks are in the 97th percentile in terms of valuation since the 1890s. Therefore, rising inflation and bond yields could cause stocks to fall sharply even without a recession.
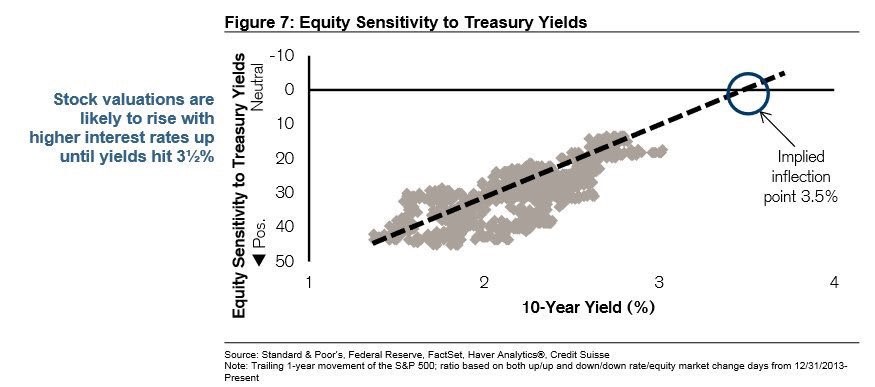
Equity Sensitivity To Yields
If you’re curious about how much stocks can fall without a recession, the table below shows the historical double digit losses with no recession.
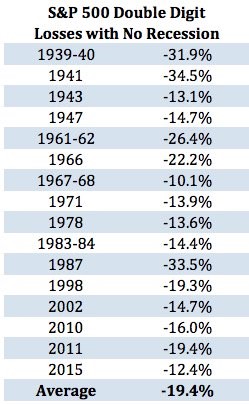
Biggest Corrections Outside Of A Recession
The average decline is 19.4%. The famous 1987 correction was one of the largest as the market fell 33.5%. Usually, stocks fall quickly and rebound quickly during these types of sharp sell offs because the economy is still on solid footing. The first chart in this article showed how the economy could be in a recession in 2-3 years. This table shows that you don’t need to wait for a recession to experience sharp losses. This market is especially risky because of such high valuations and euphoric sentiment. However if equities turn into a bear market, on average the correction is upwards of 50%.
Consumers Are Extremely Optimistic
Unsurprisingly, consumers have become more optimistic that stocks will rise in the next 12 months than ever before. This is probably a good reverse indicator, to suggest that we are nearing a market correction. Consumers don’t know or care to know that valuations are near their records. The only thing they know is stocks are going up and they want to be a part of it, akin to cryptocurrency which is nothing but a massive bubble (bring on the hate comments). If you’re observing the stock market thinking that the behavior in 2017 and early 2018 is bizarre, recognize who is buying. Stock valuations matter the least when they should be heeded the most. It’s up to each investor to decide how he or she is willing to trade a market temporarily run by the dumb money.
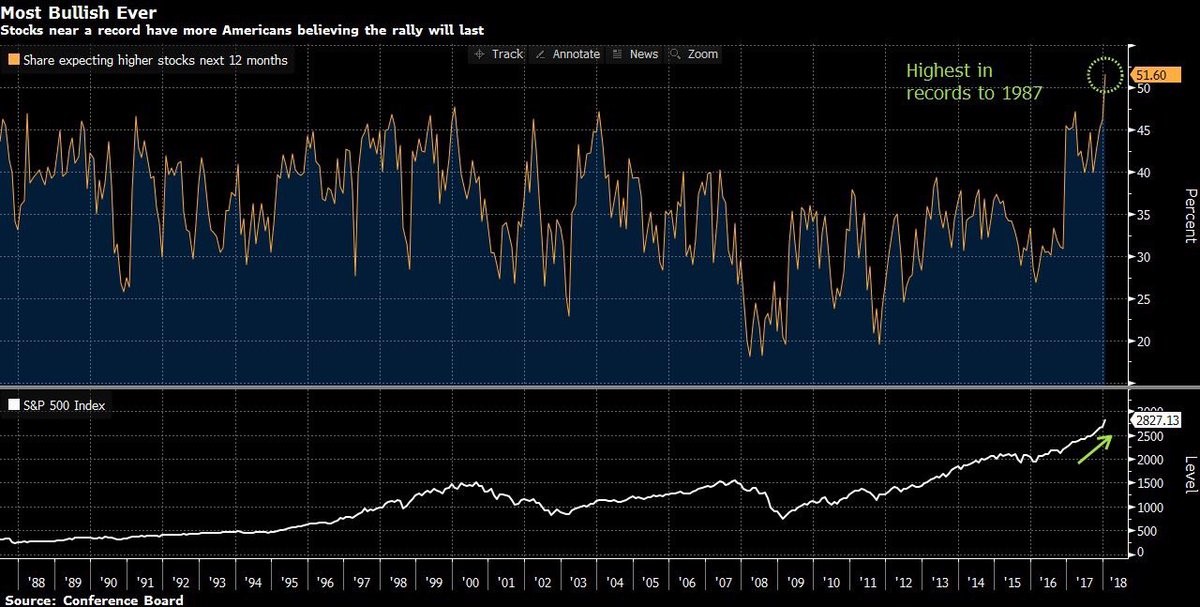
Consumers Have Record Optimism About Stocks
Conclusion
Higher inflation, low unemployment, a flattened yield curve, high stock valuations, and euphoria all show the economy is at the end of the business cycle. However, most of the indicators signal there is still some room to run. The one which is the most disconcerting is the euphoria in consumer sentiment on stocks. This could lead to a correction like the ones listed above which occurred without a recession. It’s a dangerous and short-lived game to buy stocks along with retail investors who have no idea what the CAPE is or what it means.
Have comments? Join the conversation on Twitter.
Disclaimer: The content on this site is for general informational and entertainment purposes only and should not be construed as financial advice. You agree that any decision you make will be based upon an independent investigation by a certified professional. Please read full disclaimer and privacy policy before reading any of our content.


