UPFINA's Mission: The pursuit of truth in finance and economics to form an unbiased view of current events in order to understand human action, its causes and effects. Read about us and our mission here.
Reading Time: 5 minutes
A Good Research Process Defines Alpha
There are many misconceptions when it comes to investing because there are many people who make money by promoting false narratives. There are newsletter providers who have an audience that wants to hear a narrative, whether it’s bullish or bearish. They get paid to provide certain incorrect information. The fact that so many investors have misconceptions is great news for smart, rigorous investors. If you can cut through the falsehoods, in a non-biased way, you can gain alpha or at least avoid falling into money losing traps. We’re not trying to make predictions in our articles. Instead we nitpick narratives to separate fact from fiction. If you are going to make an investing decision, you should do it with the correct facts and no bias. It’s not pleasant to lose money while investing to later find out that you had misconceptions that forced you to research in the wrong areas. No matter how good your research is, sometimes the market doesn’t go in your direction. However, if you have a good research process, long term gains will make up for losses.
Corporate Debt Bubble?
It’s important to understand that perma bearish (and bullish) investors selling newsletter subscriptions don’t care if they are right. Their interests are aligned with gaining social media followers and paying subscribers. You might make the argument that making good predictions would help subscriptions, however, that goes against empirical evidence. These bearish investors exist because there is a market for them. We’ll make the further contention that bull markets are better for their business. If everyone is bullish because the economy is good and fund managers selling advice are bullish, then there’s less competition for the perma bears to sell bearish newsletters. The only issue is the pesky facts which mostly show the economy isn’t about to fall off a cliff and the stock market isn’t about to fall 50% again. That’s where the false narratives come in.
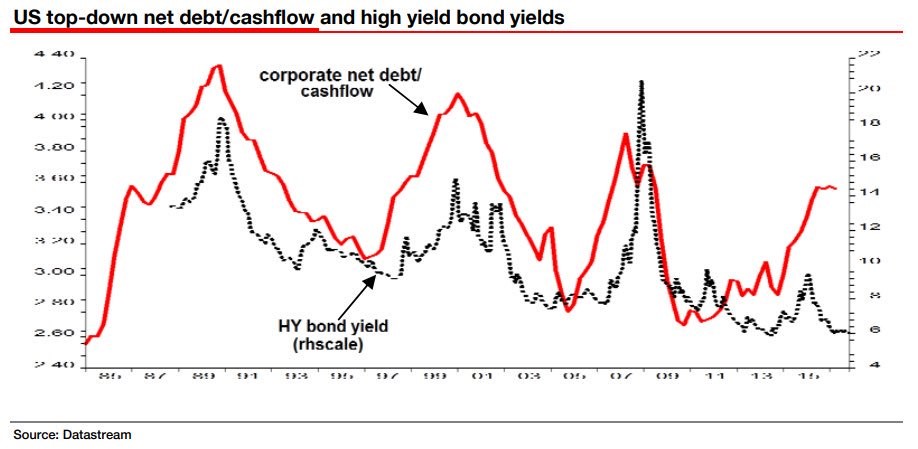
The first chart promotes one of the false narratives which is that corporations are too highly levered.
Gloom And Doom Because Of High Corporate Leverage
The black line shows the junk bond yield. It shows how low junk yields have gotten. That’s partially because interest rates have come down and partially because the credit spread has fallen because investors are hungry for risky bonds at the end of the business cycle when corporate profits are soaring. The spikes in yields act as indicators of recessions in this chart. The red line is the corporate net debt to cash flow ratio. The previous spikes in the debt to cash flow ratio indicated a recession, but this increase clearly hasn’t happened in tandem with a recession. If you look at this chart from a biased bearish perspective, you’ll think a recession is coming, but if you are non-biased, you would ask the question why this time is different. There’s no indication that the economy is about to be in a recession in 2017. You can deny reality by claiming the facts of the economy are wrong, or you can investigate further.
We will investigate this situation further because there’s an answer to this question which shows why the economy didn’t crash in 2016. Furthermore, it helps explain what will happen in the future because when you correctly understand the past, the future is easier to see. The reason the corporate debt increased is because of weakness in the energy sector. The small peak in the junk bond yields in 2016 was also related to this energy weakness. The stabilization of oil prices in 2017 explains why the net debt to cash flow metric has stopped increasing.
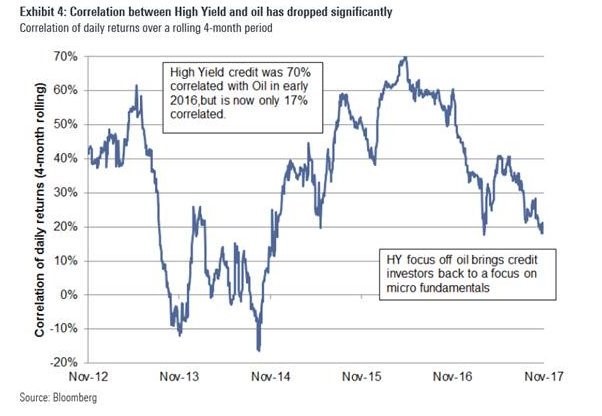
The chart below provides support for our point that energy caused this weakness in the junk bond market and overall debt in the corporate sector.
Junk To Oil Price Correlation
The chart above shows the 4 month correlation of the high yield bond market and oil prices. The correlation in 2016 peaked at 70%. That’s because the energy firms dominated the junk bond market because they issued so much debt to avoid having a liquidity crisis. Their cash flow dried up because their hedges were expiring and new ones needed to be made at lower oil prices, sometimes below the cost of production. Lately, the correlation between the price of oil and the junk bond market has fallen. It’s now at 17% because WTI oil is in the high $50s, meaning the energy sector is less important to the junk bond market as these firms have had an increase in cash flows.
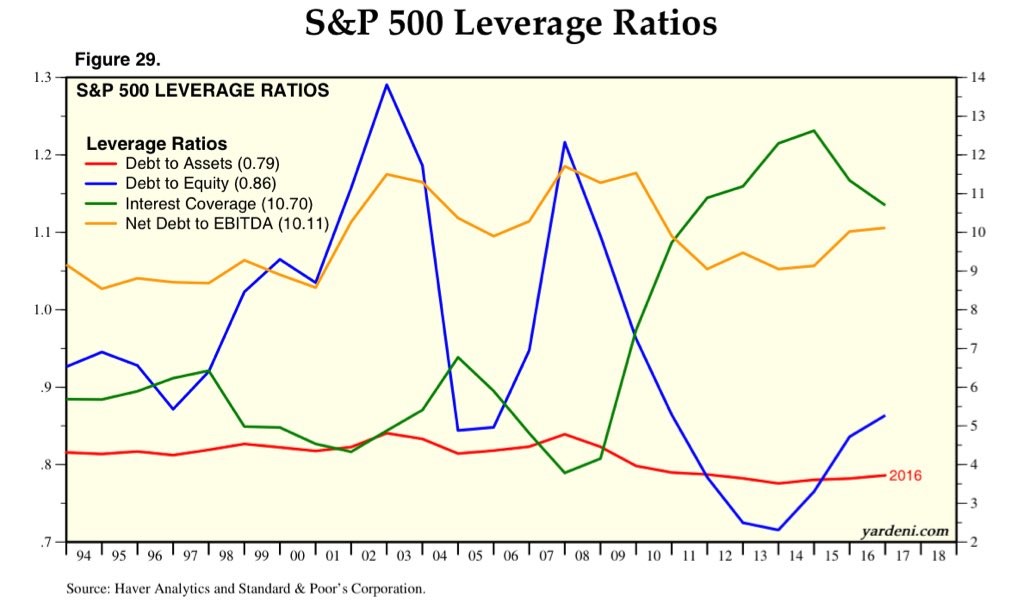
A better estimate of the corporate debt situation is seen in the chart below.
Corporate Leverage Is Healthy
The mistake many perma bears make is looking at the debt levels without looking at the growth in equity. Pointing out the fact that earnings growth is in a ‘bubble’ is not an argument. There needs to be a reason why you think corporate earnings are unsustainable. As we have pointed out previously, in the long-term the high profit margins are actually negative for the US economy, because are partially the result of less competition and less small business. Corporate earnings are certainly cyclical, but that doesn’t prove that they are in a bubble. That non-argument aside, the debt to assets ratio looks more than fine. It will probably get better when it’s updated to reflect 2017 data because corporate earnings were strong in that year. The interest coverage ratio is very high showing firms can easily make their debt payments. That’s benefited by low interest rates, but the fact that it is so high means there wouldn’t be a shock to the system if rates rise. To be clear, higher borrowing rates would hurt profitability, but won’t necessarily catalyze a debt bubble burst. For instance, leveraged loan maturity, as we have discussed previously, is set to mature in an increasing fashion and peak only in the early 2020s, therefore nothing is imminent. Neither the net debt to EBITDA nor the debt to equity ratio are problematic since equity has been on such a remarkable rally.
Conclusion
Using debt ratios which aren’t highlighted because they imply coming devastation shows the corporate debt leverage is healthy. You can’t make the argument that the debt ratios would be weak in an economic crisis because everything would be weak in a crisis. The key would be predicting what would cause that crisis, not worrying about the debt levels. High debt levels do cause more painful credit cycle unwinds, but if the catalyst of the debt to equity ratio weakness is a decline in equity, that can snap back quickly when the economy improves.
Have comments? Join the conversation on Twitter.
Disclaimer: The content on this site is for general informational and entertainment purposes only and should not be construed as financial advice. You agree that any decision you make will be based upon an independent investigation by a certified professional. Please read full disclaimer and privacy policy before reading any of our content.


