UPFINA's Mission: The pursuit of truth in finance and economics to form an unbiased view of current events in order to understand human action, its causes and effects. Read about us and our mission here.
Reading Time: 5 minutes
In this article, we’ll look at charts which show the drivers of the current economic system. When you understand what drives the system, you’ll know what matters and what doesn’t. The current system has given us poor productivity growth, low interest rates, and high stock prices. If the dynamics of the economic system change, those results will change. The best way to get a grasp of the economy is to look at big picture items and ignore one off events or data points.
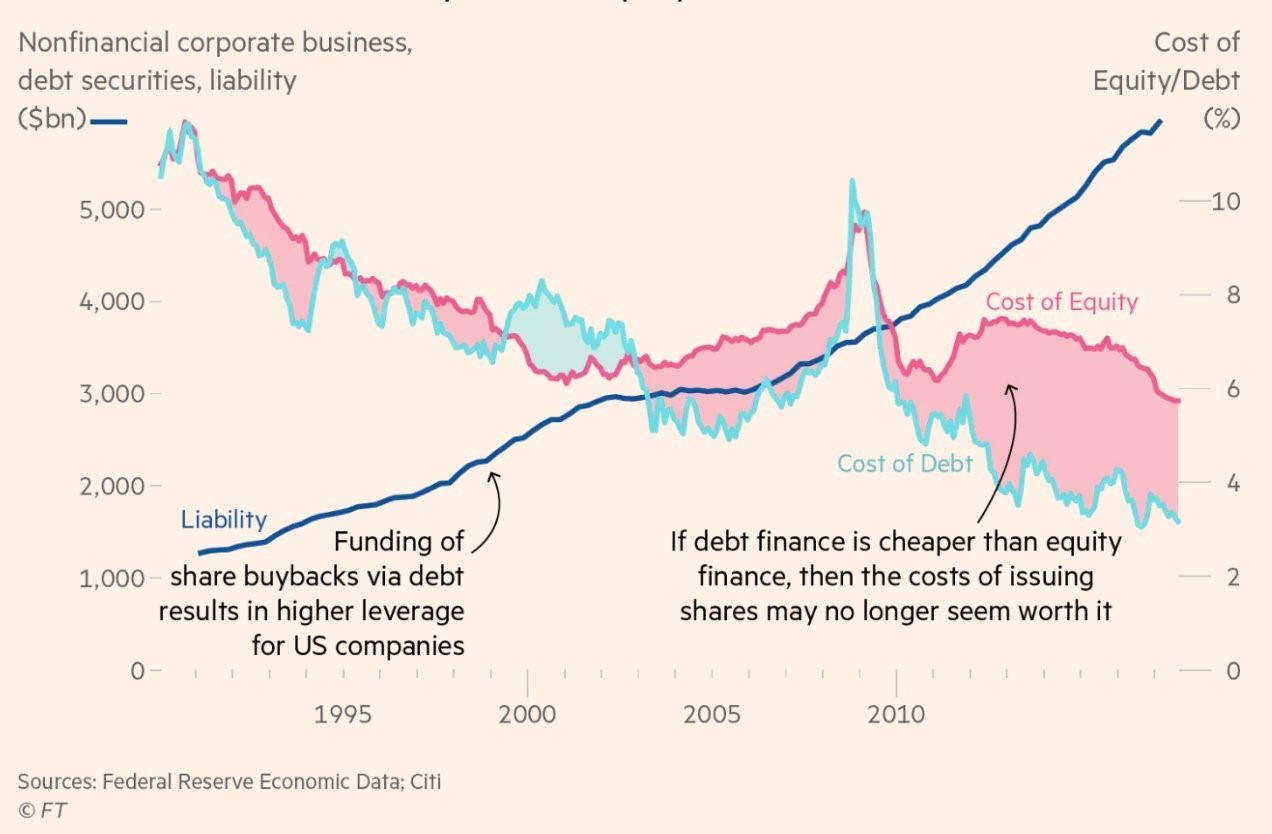
The Financial Times chart below does a great job of explaining much of the drivers of the system. The chart shows the changes in the cost of equity compared to the cost of debt.
Cost Of Equity
Cost of Debt Is Lower Than Cost of Equity
Negatives Of Buybacks
The cost of debt is the rate of return the average firm must pay to issue bonds; the cost of equity is the rate of return needed to pay to issue shares. In the past two cycles, we have seen a new phenomenon where firms are conducting excessive amounts of stock buybacks. Normally, buybacks are used to return excess profits to shareholders. The other way firms return capital is through dividends, but buybacks have a tax advantage since cash dividends are taxed when you get them, while the theoretical stock appreciation that buybacks bring allow you to avoid taxes until you sell the stock and take a profit.
Some firms have gotten overzealous in their buyback programs by putting more into buybacks than they make in profits. The number of firms that do this increases when earnings start to fall. Usually, issuing debt to finance cash dividends means the dividend is likely to be suspended; it’s a risky activity which isn’t sustainable. With buybacks, there is an equity for debt swap which makes sense for some firms because corporate interest rates are so low. The cost of equity is also relatively low, but it’s higher than debt, so the swap makes sense. The low cost of capital helps explain why corporate profit margins for the top firms are near their records. The other reasons margins are high are bigger firms are taking share from smaller companies and technology companies which are beginning to dominate the major indices tend to have higher margins.
Positives Of Buybacks
Let’s discuss how buybacks can get a bad reputation from investors. First, it’s important to point out that profits must go somewhere. Either the money gets returned to shareholders or it gets invested in the business. Determining whether buybacks or reinvesting the capital makes sense is a complicated process determined by the CFO and other managers. Buying back stock looks like a terrible move in hindsight after crashes because the price has fallen. However, it’s worth noting that investing the money into the business also doesn’t look great right before recessions because demand declines. Another aspect that looks bad is acquisitions because valuations fall during recessions. The trend is that every move looks bad before a recession. Buybacks only look specifically bad because you can see the stock falling in real-time.
The only way to avoid poorly timed investments is to never take business risks before recessions. This requires firms to either never take risks or predict recessions. Neither is feasible because risk is necessary and predicting recessions is tough for a firm which doesn’t specialize in that (most of them). When you ask someone who is against buybacks why they are against them, they will say stocks sometimes crash making the purchase an overpay. They say that investing in the business is a better use of capital. Sometimes in hindsight it is a better use of capital and sometimes it isn’t. The point is that these buyback skeptics are ignoring how all investments often look bad when they occur right before a recession.
U.S. Economy Is Very Leveraged
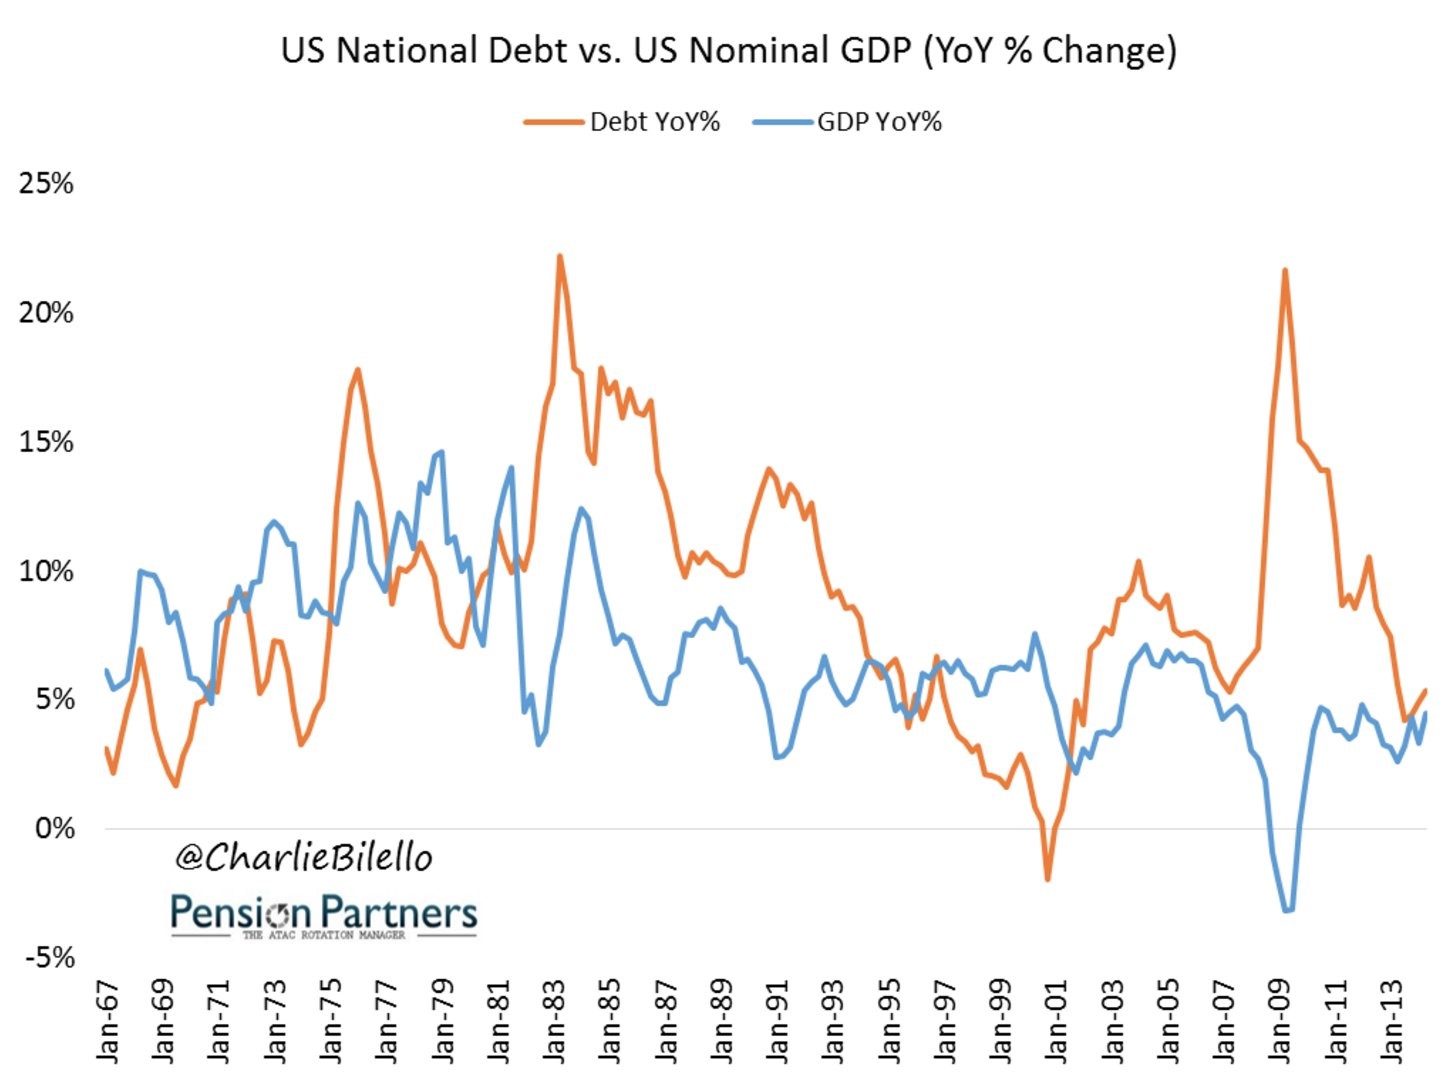
Another mega trend in the economy can be seen in the chart below from Pension Partners. It shows the debt changes year over year compared to the GDP changes year over year.
Leveraged Economy
The U.S. doesn’t get a good bang for its buck as the debt growth has exceeded the GDP growth. This is a signal the U.S. economy is in decline. The 1980s growth period was funded by extremely high deficits. The 1990s growth period was much better as GDP growth was higher than debt growth. That appears to have been a one-off as that scenario hasn’t returned since. Bringing this interest rate issue full circle, if interest rates rise, the debt that has accumulated will become a huge tax on the economy as deficits will soar, making it tough for the government to fund entitlements such as social security.
Low VIX Means Low Defaults
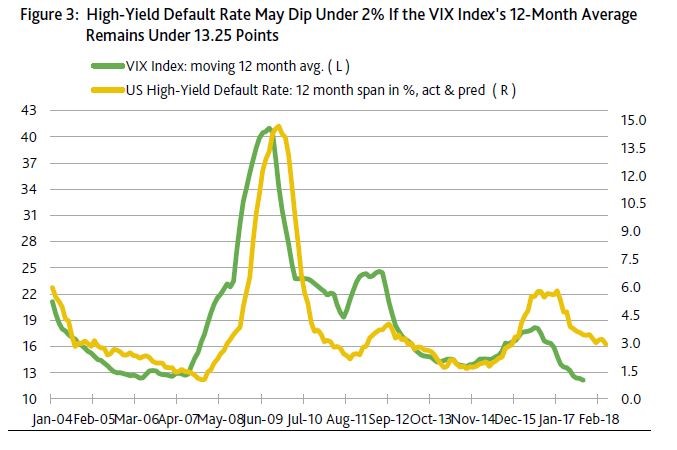
To be clear, stock buybacks can create large volatility events when the cycle turns. However, when buybacks are high, they lower volatility because they are consistent. Firms don’t look at macro events or headlines when deciding when to buyback shares. Sometimes firms buyback stock when there is a correction, which limits the downside. The other factor which has caused lower volatility this cycle has been the increase in passive investing. These index investors, when investing money, buy stocks regardless of the news cycle as well. The low volatility in the stock market has lowered high-yield default rates. In theory, if stocks were to have a volatility of zero, defaults wouldn’t happen because firms could always issue shares to pay bondholders. As you can see in the chart, the 12 month moving average of the VIX leads the high yield default rate. The extremely low VIX in 2017 implies default rates on junk debt will fall further.
VIX Leads Junk Defaults
Conclusion
We’ve previously stated that zero percent interest rates means capitalism doesn’t function properly. We are seeing that low interest rates on “risk free debt” has spurred lower volatility in stocks which then lowers junk default rates. A market with a near zero VIX and no defaults is actually a terrible scenario because capitalism is a system of creative destruction. We wouldn’t want zero companies to fail because risk is what drives the system to improve inefficiencies, rather than having zombie companies that do not create value. There’s a big difference between low risk and zero risk. We aren’t at zero risk yet, but the 10 month streak without a 3% correction in the S&P 500 is disconcerting.
Have comments? Join the conversation on Twitter.
Disclaimer: The content on this site is for general informational and entertainment purposes only and should not be construed as financial advice. You agree that any decision you make will be based upon an independent investigation by a certified professional. Please read full disclaimer and privacy policy before reading any of our content.


