UPFINA's Mission: The pursuit of truth in finance and economics to form an unbiased view of current events in order to understand human action, its causes and effects. Read about us and our mission here.
Reading Time: 5 minutes
Ten years following the global financial crisis of 2008, the US economy is showing an impressive growth trajectory based on GDP numbers. The economy reached $18.75 trillion in size in 2016. The S&P 500 is reaching new highs almost on a weekly basis and also showing a positive growth trend. But although the numbers seem positive at the outset, a closer scrutiny would reveal interesting underlying trends.

US GDP
Percentage of government expenditure varies from time to time
First of all, government expenditure is naturally a big component in GDP calculations. It is mandatory for the government to make spending on social security and healthcare regardless of tax revenues. Government spending as a percentage of GDP increased significantly following the crisis. It reached 43% of GDP after 2008 due to expenditure on deficit spending, entitlements and so forth, and it recently returned to normal levels at 34% of GDP in 2015.

US government expenditure to GDP
Source Of Federal Tax Revenues
The sources of federal tax revenue include: individual income tax, social security (payroll) taxes, corporate income taxes, excise taxes, and others. Of the total federal taxes, corporate income tax constitutes only 9.2% for the fiscal year of 2018. The largest share of taxes comes from individual income taxes, which constitutes about 47.3% of the total for the same fiscal year.
The proposed tax cuts, which mostly reduce corporate income taxes, can partially explain investors’ euphoria since those tax cuts will increase profits of corporations after taxation. Yet, increased profit made by corporations after tax and economic growth are not the same thing. While earnings increase, GDP does not necessarily head in the same direction.
Regression analysis reveals that there is a positive correlation of 0.3552 between tax deductions and contraction in GDP, which means that GDP is reduced by 0.12% for every 1% of reduction in effective tax rate. While tax cuts proposed by president Trump seem to be promising when looking at the US equities benchmark – the S&P 500 –, the prospects for GDP growth do not.
Recently, there has been growing divergence between S&P 500 and gross tax receipts. While this is not worrying on its own, it still needs to be investigated further.
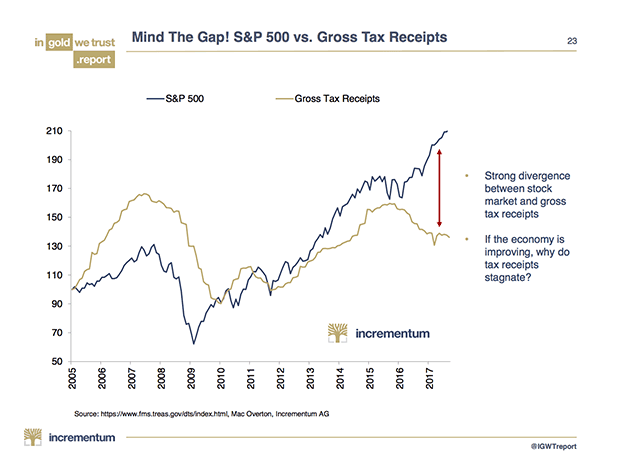
Divergence between S&P500 and gross tax receipts
The Rise of S&P 500
The recent rally in the S&P 500 has been dubbed extended by some analysts. The possibility for a corrective move to the downside is becoming greater as valuation increases. The vice president of the European Central Bank, Victor Constancio, noted that cyclically adjusted PE ratios of US equities are above their historical averages, and that this could induce a corrective move in global equities. While the flattening yield curve suggests a recession is right around the corner, it does not provide a good understanding of precise timing, as we detailed earlier. Additionally, as part of the reflexivity theory, something that could bring recession closer to reality is a decline in financial asset valuations.
However, despite the unprecedented levels in both S&P500 and the Dow Jones, this does not necessarily mean that we should jump to the conclusion that we are witnessing a bubble that is about to burst. The rise of the S&P 500 can be confounding given the current high valuations of US stocks, but the confusion can be removed by considering the equally weighted S&P 500.
At the aggregate level, the index is performing well, but if we look at the equal weighted S&P500 (in which each company is only allocated a weight of 0.2 percent), we see the equal-weighted index plummeting. In fact, when considering the equal-weighted S&P500, the divergence between it and the gross tax receipt disappears and we see a slightly stronger correlation.
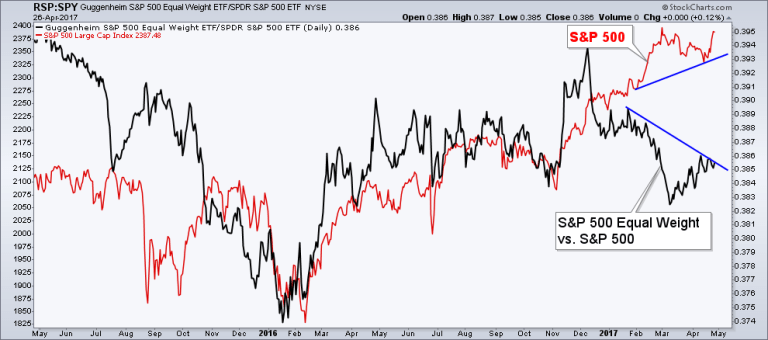
S&P 500 and equal-weighted S&P 500 divergence
Not all companies in the index are performing well. A handful of companies with the largest market caps seem to be driving the index higher. This overshadows the performance of companies with smaller market caps and which are not performing as well. Goldman Sachs recently warned that stock valuations are at their highest since 1900, and that it is alarming that equities, bonds and credits are expensive at the same time. This does signify a level of inflation, but the limits of this inflation are still not clear, and timing the market is a tedious effort for even the most seasoned investors.
As one famous fund manager wisely advised, no market is too high that it won’t go higher, and no market is too low that it won’t go any lower. A return of volatility in the markets and a decline in equities in the way some analysts expect may not happen in the near future. In fact, seeing a healthy correction in those markets can be a sign of an even stronger rise that reaches to new highs afterwards.
While there is certainly an emotional element to this rise in prices and reduced volatility, this is not entirely a speculative bubble. Consumer confidence is high. It has actually hit its highest level in 17 years as reported in late October. The unemployment rate in the US has been declining steadily since 2010, and it is now 4.1% based on the most recent reading. Overall, macroeconomic indicators are improving.
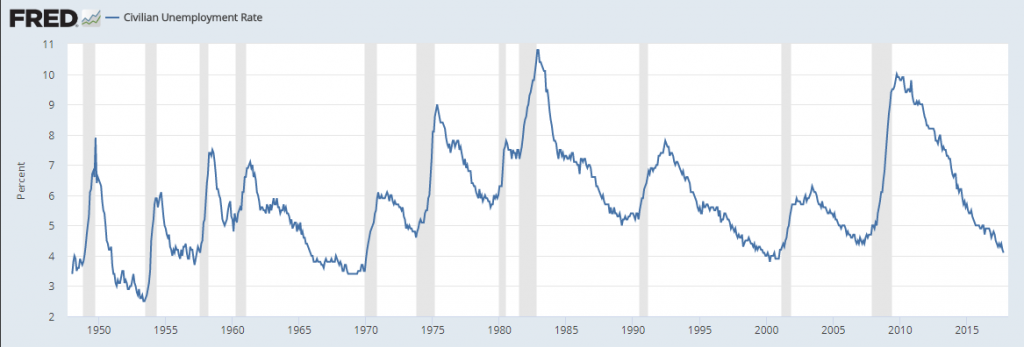
US unemployment rate
Even when government expenditure is not rising, declining tax revenues would expand the deficit, or in the best case, not decrease it. The US can manage the budget deficit given the hegemony of the dollar with a constant flow of funds, however a conflict in the Korean peninsula could be worrisome, not only from the loss of life, but for an even greater US budget deficit. As debt builds this makes the currency less attractive potentially presenting upward pressure on interest rates, and with it lower equity valuations.
Have comments? Join the conversation on Twitter.
Disclaimer: The content on this site is for general informational and entertainment purposes only and should not be construed as financial advice. You agree that any decision you make will be based upon an independent investigation by a certified professional. Please read full disclaimer and privacy policy before reading any of our content.


