UPFINA's Mission: The pursuit of truth in finance and economics to form an unbiased view of current events in order to understand human action, its causes and effects. Read about us and our mission here.
Reading Time: 5 minutes
Home Equity Is Recovering
We’ve previously examined housing related debt in the Q3 report on consumer debt. As we discussed, the housing market took a few years to recover yet the total housing debt consumers have is still below the previous peak. The home ownership rate is only now starting to recover from the downtrend it had been in since the burst of the housing bubble in 2008. As you can see from the chart below, the home equity just passed the previous peak in 2006. This recovery was tough to achieve because the equity in 2006 was propped up by low lending standards and excessive speculation. This recovery had higher lending standards, less speculation, so on that merit alone the housing market is more sustainable. However, there are still dangers because the government is still involved in the mortgage business through FHA loans, and lower interest rates, but the situation as a whole is better than it was 12 years ago.
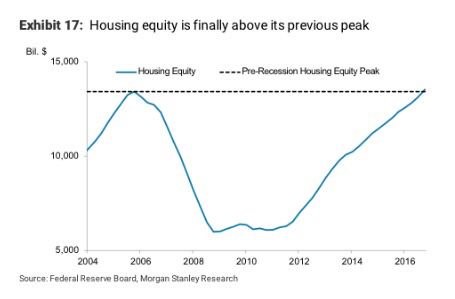
Home Equity Finally Recovered
HELOCs Aren’t As Popular As They Were In 2006
The confidence in the housing market will never get to the levels seen in the 2000s again, just like how the tech sector’s multiple will never get to the level seen in the 1990s again. People are willing to speculate in new areas like cryptocurrencies, but they don’t want to lose their money the same way (as if it matters). The zero document loans are a thing of the past, which is great. One of the other trends in the early 2000s was borrowing against the equity in homes. That’s a dangerous prospect when the equity is just paper gains which will disappear. These home equity loans are commonly called HELOCs (home equity lines of credit).
The chart below shows the net withdrawal from home equity.
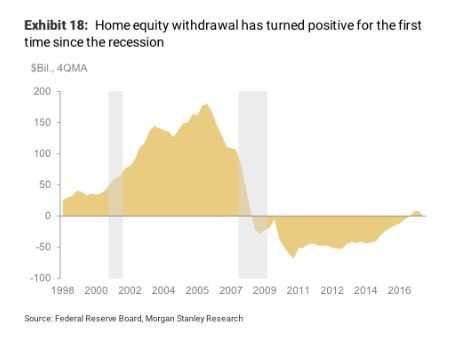
HELOCs Starting To Be Withdrawn
The withdrawals in 2006 were very high as consumers were over leveraged. The net withdrawals are only now turning positive as homeowners are skeptical of getting leveraged up again. The HELOCs are still below the levels seen in the late 1990s before the housing bubble began to build.
Some Key Cities Have Unaffordable Housing
Even though the speculation in the housing market in this cycle isn’t the same as it was in the previous cycle, the home affordability has taken a hit because wages haven’t grown as fast as shelter inflation. The chart below shows the increase in household incomes needed to afford the median priced home with 10% down and a 30 year mortgage.
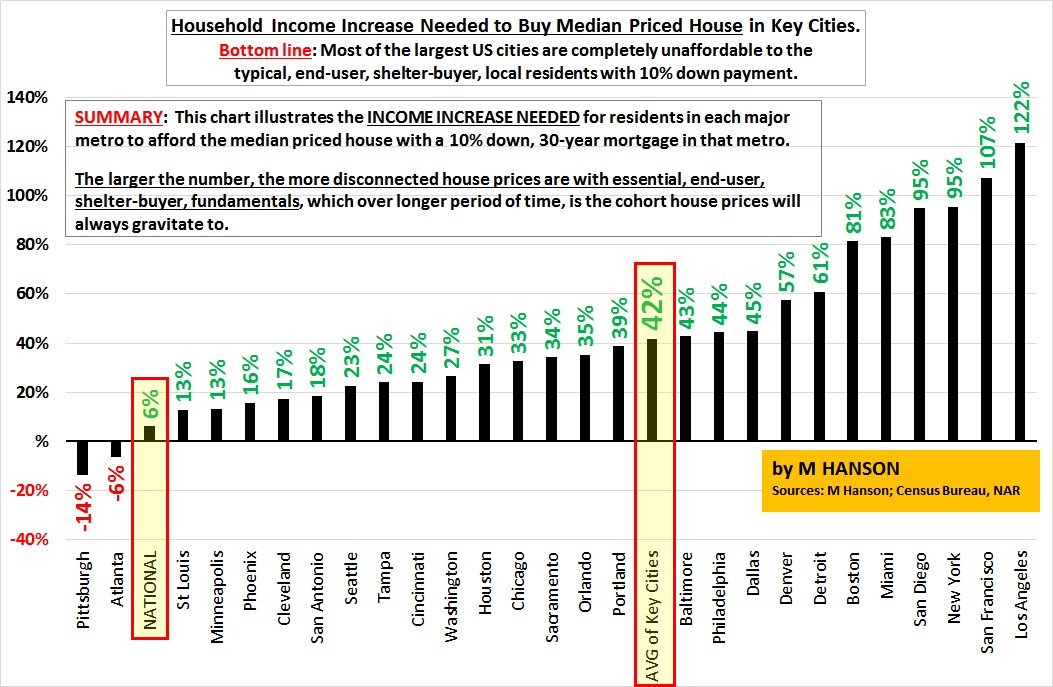
Houses Aren’t Affordable In Key Cities
The affordability issue isn’t that much of a problem nationally, but it’s an issue in the key cities as the average income will need to go up 42% to allow people to afford median priced homes. Either wages need to increase relative to shelter or some of these key cities will need to see home prices fall. While there isn’t a national housing bubble like in 2006, there might be some cities that will experience price drops if the economy falters as home prices don’t match incomes.
Rent Expenses Are Expected To Moderate
Both housing and rent expenses have led to shelter inflation increasing faster than wages. However, there’s a potential reprieve on the way for rent costs. As you can see from the chart below, the model using the home price index, rental vacancies, and the working age population is predicting that rent inflation will stabilize.
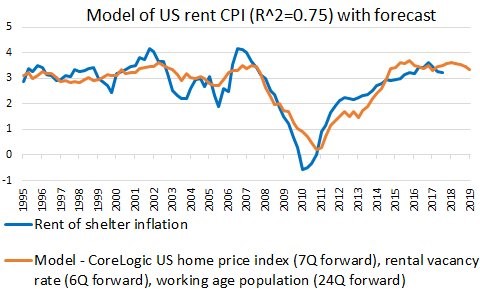
Model Of Rent Inflation Shows Rents Moderating
If wage growth accelerates in 2018, Americans can make up for lost ground from the past few years when wages grew slower than rents. As you can see, the model has been accurate when you back test it over the past 22 years. The model is highly correlated with actual results.
The chart below breaks down some of the metrics which go into the model which forecasts rent inflation.
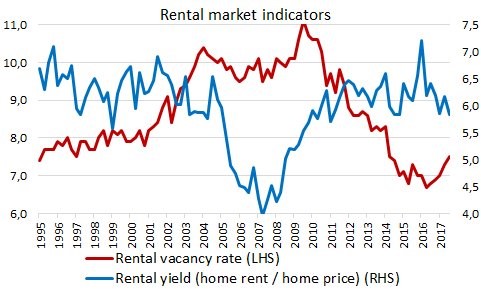
Rental Vacancy Rates Are Increasing
As you can see, the rental vacancy rate is beginning to increase, possibly because of the high price of rent or because of the over-building of apartments. The rental yield is beginning to fall. The further the yield falls, the fewer apartments will be built. That’s basic supply and demand. As you can see, the yield fell during the last recession which caused multifamily buildings to decline.
To complete this point, the chart below shows the multifamily units under construction looks like it is peaking.
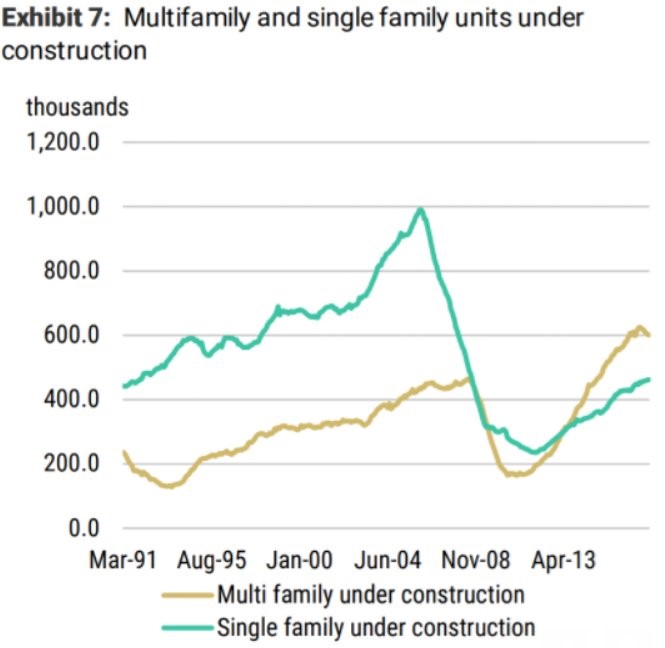
Mutifamily Construction Moderating
One potential thing to consider is that wage growth could spur demand in multifamily and single family homes which could cause prices to increase at an accelerated clip again in a few quarters. This chart also shows the single family home starts which supports the point we discussed earlier which is that this cycle hasn’t seen a complete recovery from the last cycle. The home ownership rate has declined along with the single family starts, although, the starts have recovered more than the home ownership rate because of population growth.
What This Means For Overall Inflation
Wage growth acceleration in 2018 would pressure the overall inflation metric to the upside, but decelerating shelter inflation would pressure inflation downwards. As you can see from the PCE breakdown, the housing services inflation has lately started to contribute less to year over year core inflation.
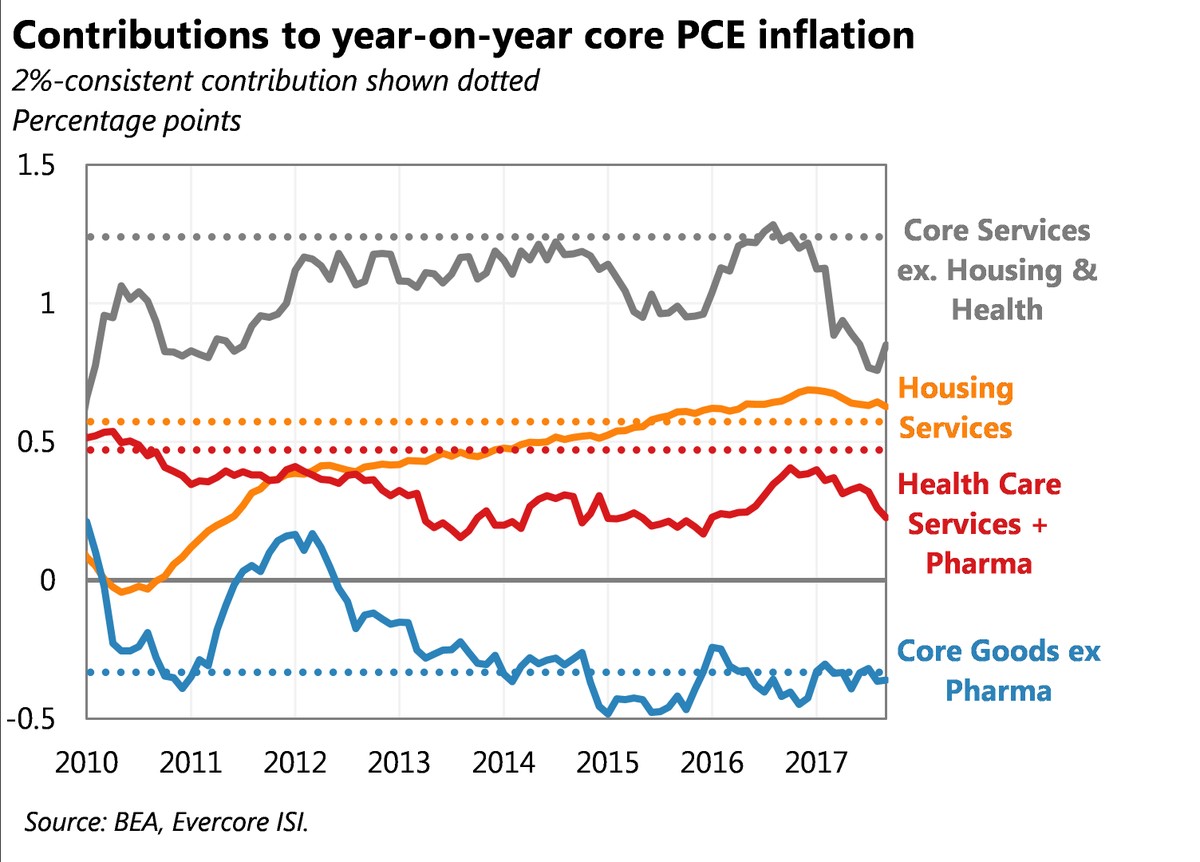
Housing Not Pushing Core PCE inflation Higher
The dotted lines show the inflation rate in each category which would be consistent with 2% inflation which is the Fed’s goal. In October, the CPI inflation had its first acceleration since January, so it’s clearly possible that inflation can accelerate without shelter costs accelerating.
Conclusion
When looking at these stats, keep in mind we are at the end of the business cycle. Don’t take that the wrong way; it doesn’t mean it can’t keep going for a few more years. It’s just worth noting how the various metrics have done during this recovery. For example, the fact that the home ownership rate is so low (which is consistent with the key city affordability chart) is disconcerting since the cycle is almost over. Will home ownership fall further in the next recession? That would put it in a secular decline which would mean most people won’t be able to afford a home. The goal of getting more people in their own home by politicians crafting legislation in the 1990s had the exact opposite effect even to this day. They didn’t think about how more demand would cause prices to increase which hurts affordability. Bad policies can have negative implications on the markets decades later.
Have comments? Join the conversation on Twitter.
Disclaimer: The content on this site is for general informational and entertainment purposes only and should not be construed as financial advice. You agree that any decision you make will be based upon an independent investigation by a certified professional. Please read full disclaimer and privacy policy before reading any of our content.


