UPFINA's Mission: The pursuit of truth in finance and economics to form an unbiased view of current events in order to understand human action, its causes and effects. Read about us and our mission here.
Reading Time: 5 minutes
In this article, we’ll review some trends which appear to be reaching extreme points. The goal of this article isn’t to recommend taking the other side of the trade. Instead it’s to explain what’s happening. There’s an interesting explanation for why markets act in unusual ways.
The first chart shows cumulative investment grade bond flows. It is a popular topic to discuss the ETF flows into stocks, but this chart is equally as interesting.
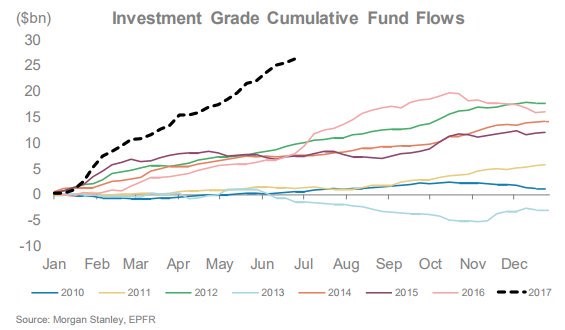
Investment Grade Fund Flows
As you can see, in 2017 the fund flows into investment grade funds have been more than any year since 2010. That’s a significant increase because investment grade debt has been receiving inflows for years. Some say that investors are buying investment grade debt because investors don’t believe the Fed will unwind the balance sheet. In theory, the Fed increasing the supply of treasuries would increase interest rates which would hurt treasuries as well as cause interest rates to rise across the board. Another way you can look at this trend is that the Fed will be unwinding the balance sheet, but the ECB will still be buying corporate bonds. That could cause the spread between investment grade bonds and treasuries to fall. To be clear, the ECB buys mainly European corporate debt, but all markets are intertwined globally.
The chart below indicates that a perplexing trend has arisen which seems to be contradictory.
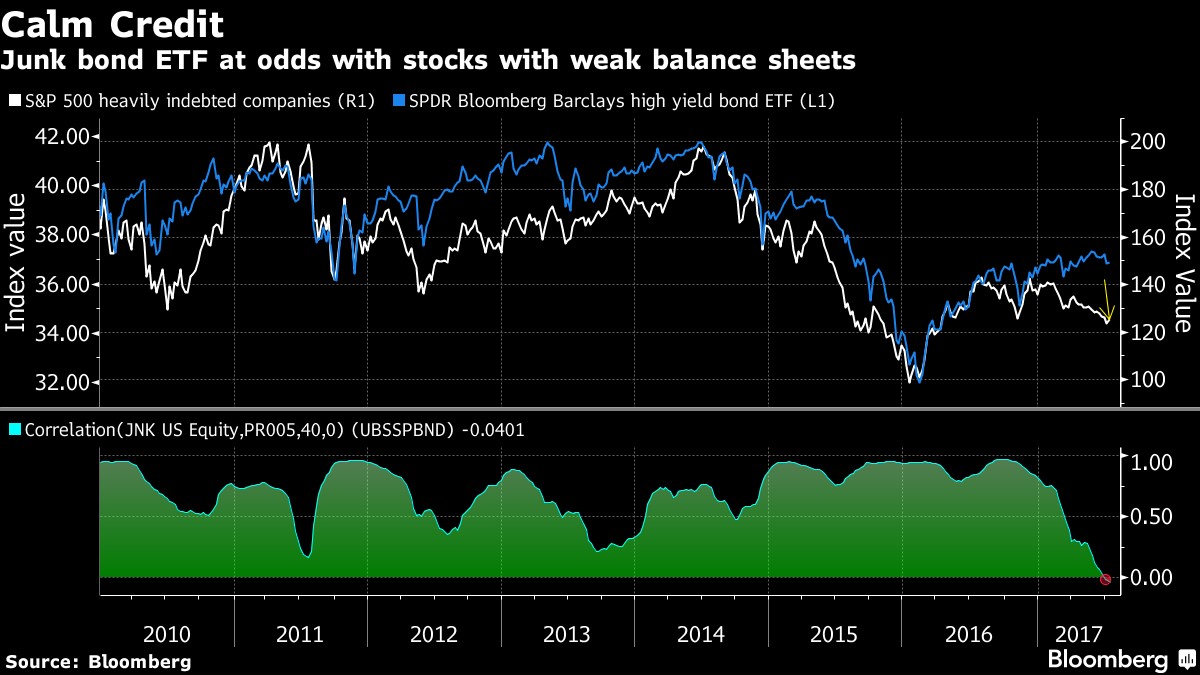
Junk Bonds & Indebted Stocks Decouple
The S&P 500 companies that are heavily indebted have decoupled from high yield bonds. It makes sense that these two metrics would be correlated because if you believe in the prospects of a risky firm, you would buy their stock and bonds. This correlation no longer exists as investors have been buying risky bonds and selling indebted firms’ stocks.
Credit spreads are almost the tightest since 2014. Lately junk bonds have ignored the selloff in treasuries. If that selloff is being caused by the unwind of the balance sheet, it would make sense that junk bonds wouldn’t feel the pressure since it’s artificial movement. The selloff in heavily indebted firms could be happenstance. Investors who buy stocks don’t only look at total debt when deciding on a trade. For example, a sector which tends to have high debt loads could have been sold because its prospects dimmed. You can tell an investor is biased when he/she tries to say that either the junk bonds or indebted stocks are telling the truth. It’s fine to formulate an opinion on these securities, but this chart doesn’t tell you where they’re going.
The graphic below shows the restaurant industry snapshot. It’s a disaster for restaurants as comparable sales in June were down 1.0% and traffic was down 3.0%.
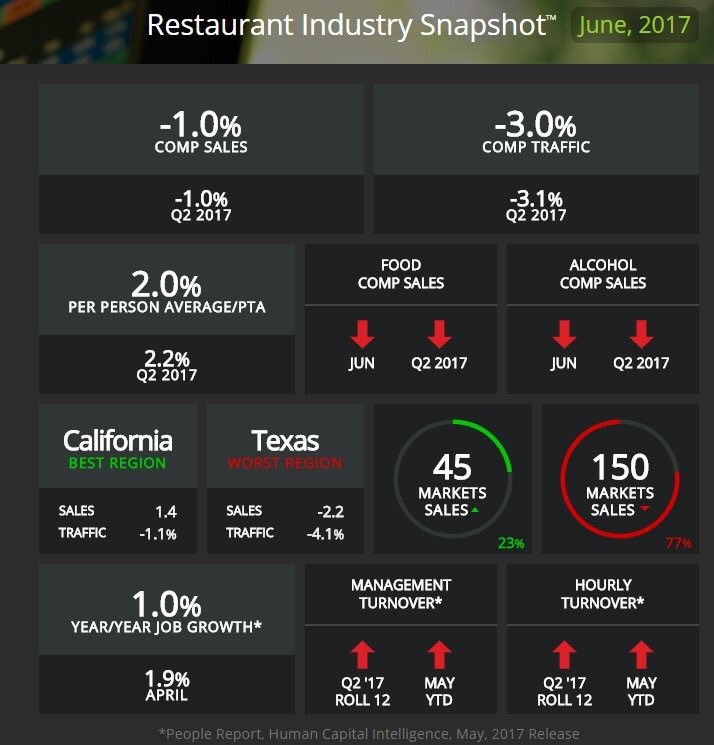
June Restaurant Industry Snapshot
Restaurant sales have traditionally been a leading indicator for economic activity, so it’s notable to see this weakness despite the supposedly strong labor market. Restaurants have been able to avoid the problems brick and mortar retail has been seeing because restaurants can’t be beat by the internet (not yet atleast). Malls have latched onto restaurants because they are an experience that people must go to in-person. It may sound silly, but those Instagram pictures of picturesque meals can’t be taken at home. Consumer sentiment has been strong, however this graphic shows those surveys aren’t telling the truth, possibly because they have been politicized.
In May job growth decelerated to 1.0% from 1.9% in April. Waiters have been a leading job created this recovery, so any downturn could stress the labor market. The economy is intermingled, so stress in one industry leads to stress in another. Watch out for this industry in the next few months to see if it decelerates further. The weaker it gets, the more likely it will affect the economy negatively.
The chart below shows a potentially pivotal change which may occur in earnings. As you can see, credit conditions have been decelerating which has historically led to declines in earnings. The credit conditions were worse than the earnings declines in 2015-2016. While this chart looks ominous, it may be too early to jump to the conclusion that earnings are about to go into a recession. We are about to start lapping tougher comparisons as the 2016 earnings bottomed in Q1. Tough year over year comparisons don’t signal a new trend is here. A year is an arbitrary time period. As long as there isn’t a swoon seen in the sequential data, the stock market should be fine.
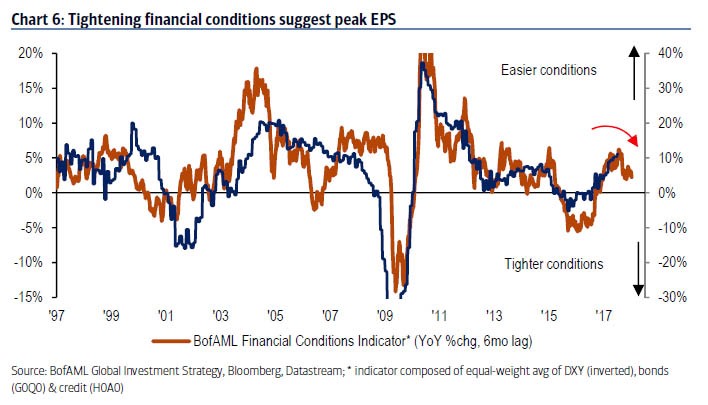
Credit Conditions Versus Earnings Growth
As you can see from the chart below, Q2 will likely have decent growth. Usually firms beat expectations so year over year growth will be at least 6.8%.
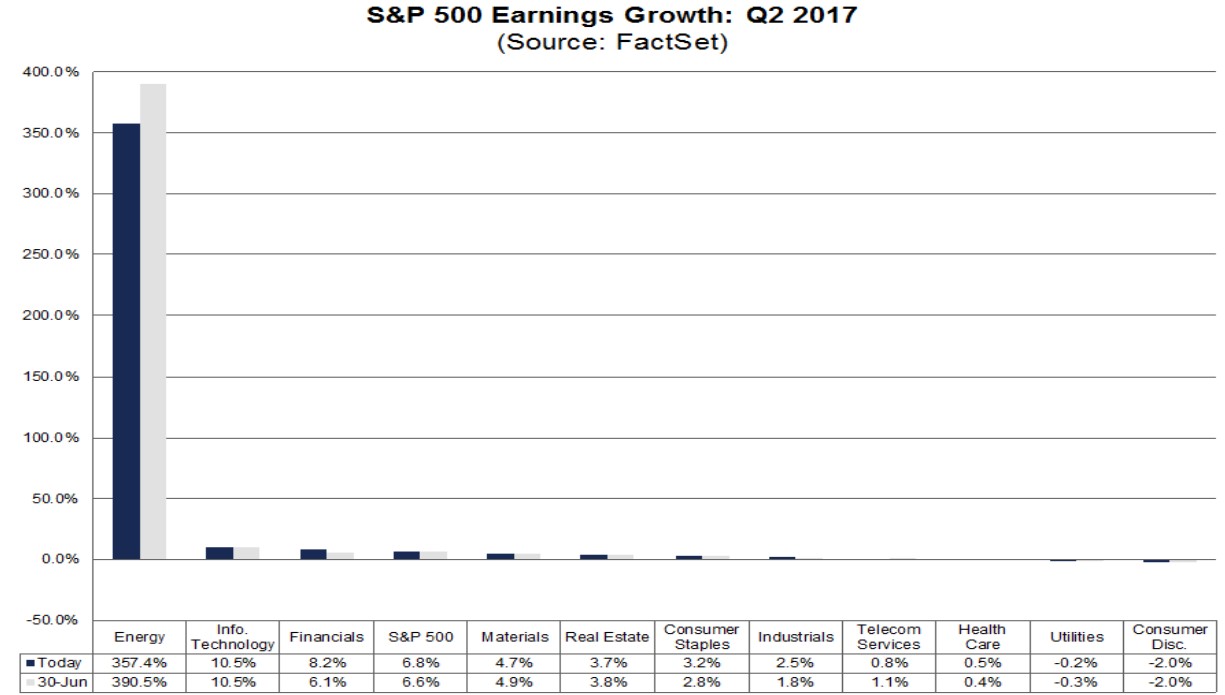
Q2 S&P 500 Earnings By Sector
The biggest contributor to earnings growth is the energy sector. It’s still being helped by the weak comparisons in 2016 as firms were reeling from the collapse in oil prices last year. Q3 will start to face tougher comparisons as energy earnings are only expected to grow 153.6% year over year.
Besides the trend of energy firms facing tougher year over year comparisons, another thing to pay attention to is overall margins. Margins are nearing their 2014 peak. In Q2 2017, they are expected to reach 10.40% which is greater than the peak in Q3 2014 which was 10.10%. Margins usually mean revert as they can’t keep going up forever due to competition. As of early in the Q2 reporting period, margin growth is accelerating as it is up 15.16% (percentage of a percentage) which is more than the 12.46% improvement in Q1. This trend should hit a wall soon which could hurt earnings growth as sales growth is weak. Sales are only expected to be up 4.51% in Q2, so even that great quarter will see mediocre sales growth.
Conclusion
Those are some trends to watch out for in the next few months. The movement in markets will be greatly affected by whatever central banks do. They are expected to unwind their policies through tapering and reductions. This has never been done on this scale, which could be a significant catalyst for downside risk in late 2017 and early 2018.
Have comments? Join the conversation on Twitter.
Disclaimer: The content on this site is for general informational and entertainment purposes only and should not be construed as financial advice. You agree that any decision you make will be based upon an independent investigation by a certified professional. Please read full disclaimer and privacy policy before reading any of our content.


