UPFINA's Mission: The pursuit of truth in finance and economics to form an unbiased view of current events in order to understand human action, its causes and effects. Read about us and our mission here.
Reading Time: 5 minutes
Many times, the reason a financial crisis isn’t seen beforehand is because it is disguised by optimistic assumptions which become unreasonable. It’s difficult to determine which assumptions are unrealistic because the trends take years before they bubble over. For example, over-eating for a month probably won’t have negative effects on your health, but if you do it for years, you become obese. Housing prices exceeding inflation for a couple years wasn’t a big deal until the speculation got to the extreme level. You often hear websites speaking caution about bubbles, but in that early phase, it’s a good idea to ride the wave.
When the blow-off top comes, it’s obvious to everyone the bubble will burst. A blow-off top is the end of the bubble where returns come quickly. It’s the most obvious time to short the bubble, but also the most painful. You need to have the proper mindset when assessing these situations. It would be risky to aggressively short a bubble. Failed investors will analyze whether it is a bubble giving them false confidence in their strategy. Of course, housing was in a bubble in 2005, but the tough part is timing it with any accuracy. The key is to manage risk and be patient.
Getting back into the economic aspect of bubbles, the other tough to predict aspect is the effects on other assets. It’s difficult to model tightening credit markets because businesses and consumers go from acting irrationally aggressive to irrationally cautious. It makes sense to pull back during recessions, but the question is ‘how much?’ Specifically, the determination is how much tightening markets increases the cost of capital. At the extreme end, increasing junk bond yields can cause a mass amount of bankruptcies. The global economy is intertwined. While a stable company won’t be at risk of paying back its loans, profitability takes a hit.
The interest coverage ratio is a firm’s earnings compared to the interest on a firm’s debt. You can look at it as the ratio of your paycheck to you bills. An interest coverage ratio below 1 is when the interest is higher than the income, but that’s where it gets dicey as extraordinary actions need to happen such as major refinancing to prevent bankruptcy. When the economy is healthy and rates are low, it’s easy to skirt along the edge, tempting fate by maintaining a high amount of leverage. When the economy isn’t healthy, sometimes even the businesses that didn’t look to be in trouble end up failing. This is because the numerator, which is earnings, shrinks and the denominator, which is debt payments, increases.
The IIF chart shows the historical interest coverage ratios for firms, broken down by market cap.
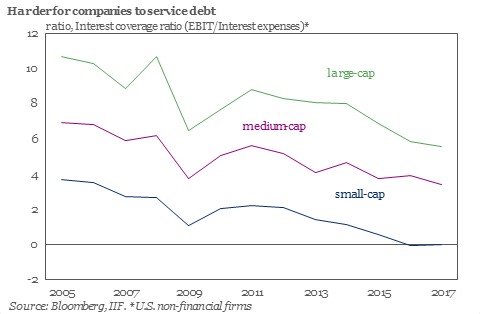
Declining Interest Coverage Ratios
Small cap firms are an example of firms riding the edge because their ratio is near zero. In this case, firms must borrow more money to pay the interest on their existing debt. That’s a recipe for disaster. The small caps have the lowest coverage ratio because they intend on using the money they borrow to grow their earnings quicker than large caps. Large caps are usually more mature firms which are cash cows. Even the medium cap firms are looking weak as a coverage ratio below 2.5 is considered a warning sign and they are inching closer to that. All categories are at or below their 2009 lows despite the low interest rate environment, which is a negative signal.
Corporate debt growth has been outpacing earnings causing coverage ratios to look ugly even for large caps which are seeing record earnings. This is causing long term debt to be issued. It’s easy to get hooked on issuing long-term debt with interest rates so low. It’s arguably in shareholders’ best interest for management to issue more debt to take advantage of low rates. This debt could be issued to invest in the business, fund acquisitions, or buyback stock. With the long-term debt, the most pivotal process is being able to roll over the debt before it comes due. Because the yield spread has tightened ever since it became wide in early 2016, this rolling over process has gone smoothly.
The chart by Leveraged Loan shows how the maturity wall has moved backwards.
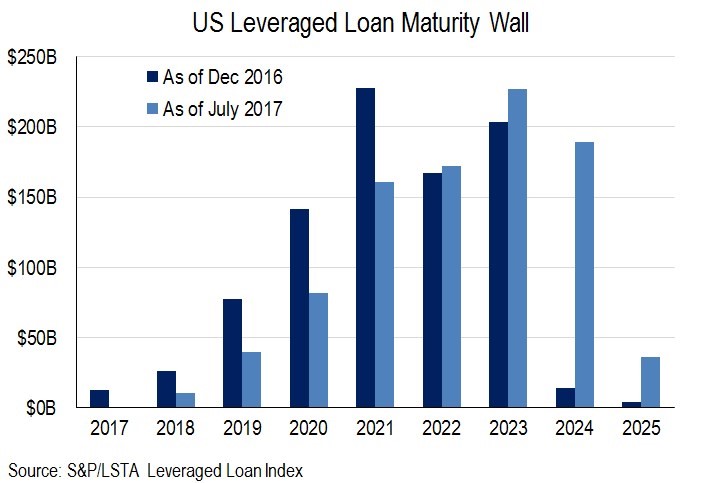
Maturity Wall Pushed Back
The maturity wall is the large amount of leveraged loans coming due in a specific year. The high bars look like a wall. The chart shows how the leveraged loans coming due in the next 4 years have fallen; they have risen in the following 4 years with a notable rise in 2024 debt. You might be asking why firms don’t issue debt with longer maturities. Some do, but many can’t afford the high interest rates that come with that as we discussed with the low interest coverage ratios.
The wall isn’t a big deal in strong economic periods, but it gets dicey when spreads rise. The longer the recession, the more debt which won’t be able to be rolled over. It would be devastating for a recession to last over a year, like in 2008 because stocks anticipate trouble coming. Stocks price in when there’s a potential liquidity crunch coming. This means stocks would fall as this slow-moving train wreck came to fruition. To be clear, we’re not at the point where the train wreck is happening, but it’s clear to see how this wouldn’t end well if a negative catalyst knocked down the economy.
Conclusion
Whether the economy is near a recession or still a few years away depends on interest rates. The growth assumptions made by small caps could be too optimistic if rates rise. That would lead to many of them defaulting on their loans. Part of the dip in interest coverage ratios is from the weakness in the energy sector, but it’s still disconcerting to see them below the previous recession levels. You can see the leveraged maturity wall growing larger. It is like a bridge bearing more load than it can handle. Eventually there will be a burst. It’s not clear if the size of the debt will cause a recession or if it will simply make it worse when it happens. The interest rates in 2016 were the lowest in human history so we don’t have an easy money situation to directly compare it to. Previously when the Fed kept interest rates too low it created the tech bubble and the housing bubble. We’ll see if this time is different. Hint: it isn’t.
Have comments? Join the conversation on Twitter.
Disclaimer: The content on this site is for general informational and entertainment purposes only and should not be construed as financial advice. You agree that any decision you make will be based upon an independent investigation by a certified professional. Please read full disclaimer and privacy policy before reading any of our content.


