UPFINA's Mission: The pursuit of truth in finance and economics to form an unbiased view of current events in order to understand human action, its causes and effects. Read about us and our mission here.
Reading Time: 5 minutes
For your reference, we’ve discussed housing in previous articles:
- What Comes Next For Housing Prices/Rent?
- The New Trend In Housing
- The Future of US Housing Market
- Is US Housing In A Bubble, Again?
As mentioned previously, the United States has been experiencing a decline in the homeownership rate. It’s important to recognize that the inability to own a home represents a significant problem.
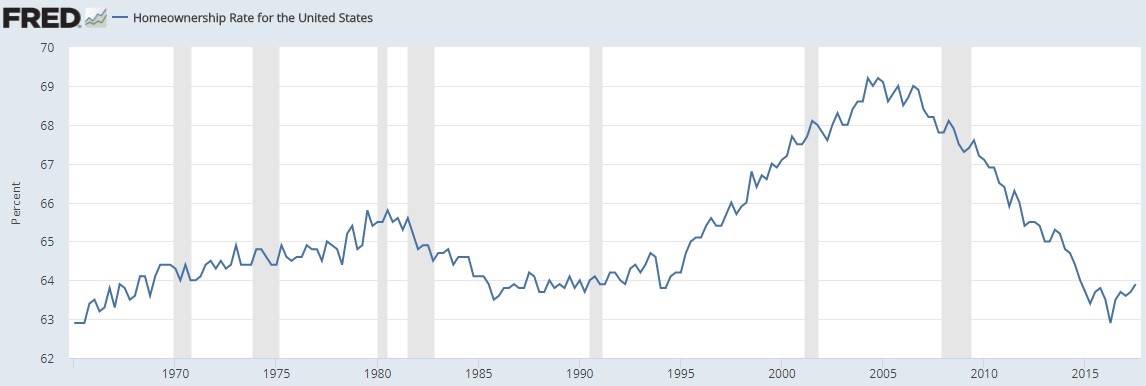
The Homeownership Rate Has Crashed
Regardless of whether you consider owning real estate to be a good investment, owning a house at the end of a working lifespan helps during retirement as it eliminates most shelter expenses, aside from upkeep and property taxes. Furthermore, the ability to own a home shows people are financially stable. Obviously, the homeownership rate can be manipulated like during the housing bubble. The fact that the government felt the need to try to get people in houses they couldn’t afford is a toxic mixture of short-termism and trying to mask a bigger issue, namely the lack of real wage improvement.
Land Prices Have Spiked: This Time Less Consumers Benefit
We’ve shown the homeownership rate which hit a multi-decade low in 2016. The concern is that during the next recession the homeownership rate will continue falling as millennials have a difficult time moving out and paying off their student loans, let alone being able to afford to buy a house. As you can see from the chart below, land prices have been increasing this cycle, reaching levels last seen during the peak of the housing bubble in 2007.
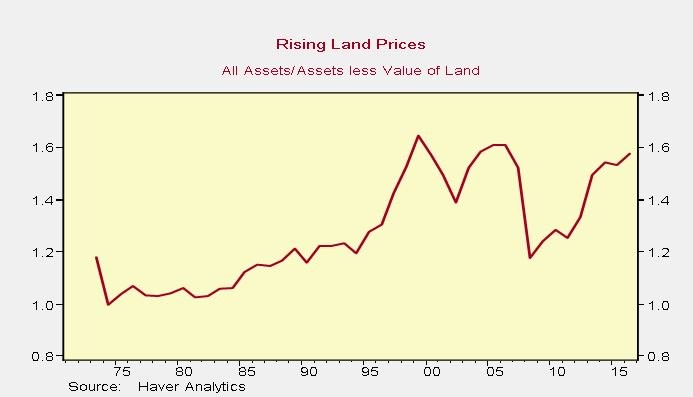
Land Prices Are Up
The difference between this increase in prices and the last two is less people own a home as the lending standards have increased and prices have become unaffordable. The silver lining to this is at least these people who don’t own homes won’t participate in the next down cycle.
Furthermore, rent has also become less affordable. Rental income was 4.6% of American personal income in November 2017, which was a record going back to 1959. In previous articles, we’ve mentioned the relative moderation of shelter inflation, but that doesn’t discount the years of high growth leading up to this. Also, growth moderation still is an increase; it’s not like rents are being cut.
In previous articles we’ve mentioned that comparing the gross value added of S&P 500 firms to GDP is a bad idea because the sales of S&P 500 firms come from both the US and abroad. The gross value added of housing as a percentage of GDP is different because real estate is all domestic. However, the chart below has a different issue, namely that from 1973 to 2010 the average square footage of single family homes increased by 44%. Therefore, the chart below isn’t as bad as it looks.
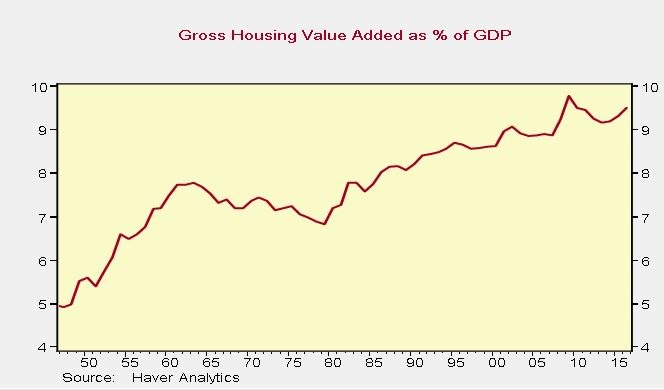
Housing Is More Valuable Because They Have Gotten Bigger
Home Square Footage Per Person Is Increasing
While land prices are increasing and the homeownership rate is down, the good news is the size of homes has increased. In the next few decades it will be critical to see if house sizes continue to increase given the prevalence of millennials buying tiny homes, RVs, and living in apartments in cities. Their economic problems also mean they will probably have fewer kids than previous generations which means the decline in square footage per person will be mitigated.
As you can see in the chart below, the average household size has been declining for decades. In 1973, there were 3.01 people per household and in 2015 there were 2.54 people in each household on average. The median house size has increased from 1,525 square feet in 1973 to 2,467 square feet in 2015. Using the median instead of the average allows us to see a clearer picture by removing the outsized impact of extremely large home owned by wealthy individuals.
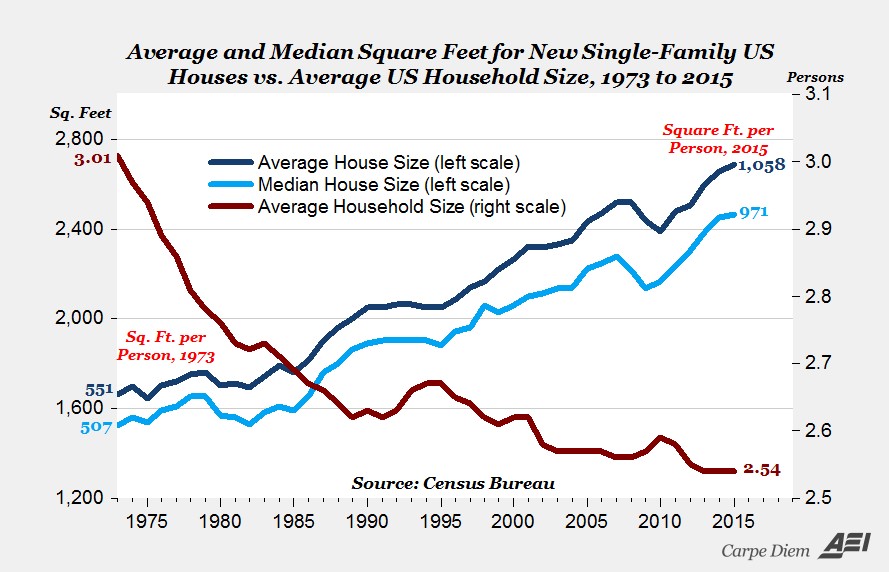
House Square Foot Per Person Is Up Huge
The price per square foot of each new house is also relatively affordable. As you can see, the inflation adjusted price per square foot of new houses in 2015 was only slightly above the long term average of $115.93.
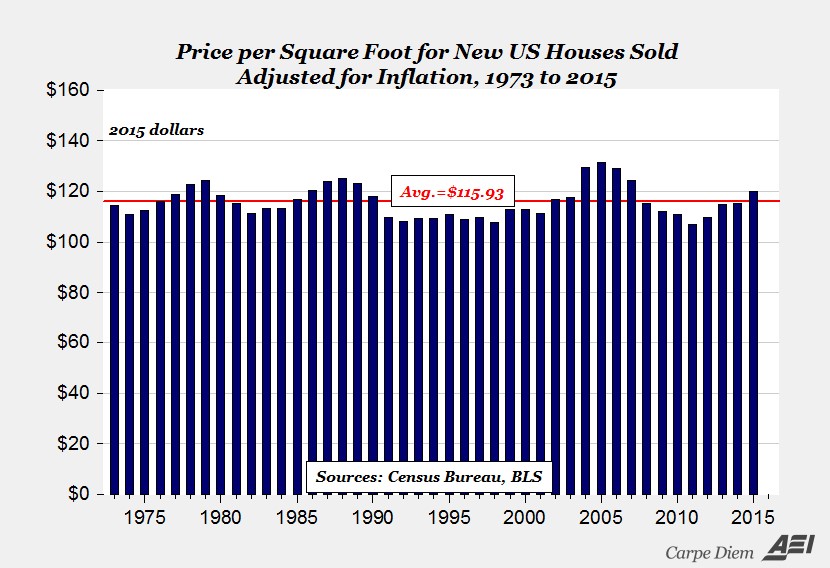
House Price Per Square Foot Is Reasonable If You Can Afford A House
The price per square foot is down 8.5% from 2005. The quality of new homes is also better as they are more energy efficient. Even smart homes, where you can control everything digitally, are becoming more prevalent.
Figuring Out The Discrepancy
There’s a discrepancy between the positive spin and the negative narrative we’ve reviewed. Is the shelter situation for households good or bad? To help you figure that out, let’s look at the reason for the differences. Median houses from 1973 to 2015 increased in price by 70%. Median house sizes have increased by 62%, but that doesn’t matter much if you can’t afford to buy a house. It’s like if a gym membership went from $20 per month to $500 for 2 years. The deal is similar, but if you don’t have $500 up front, you can’t join. The increasing house sizes is a good sign because it means people have more real dollars to spend on houses. The issue is this demand is pushed up by the upper class, while the lower class falls behind as inequality increases. This is reflected by the declining homeownership rate.
Conclusion
We try to differentiate our articles by discussing both the good news and the bad news. There’s nothing wrong with having an opinion on a subject, but while taking a side, you still need to remain objective. That’s why we reviewed the bullish and bearish narratives on housing. In summary, houses are getting bigger, but less people can afford them. If you can afford a home, your personal finances are better than the previous generation as houses are more efficient and technologically advanced. Unfortunately, the downtrend in homeownership more than made up for the upturn created by the housing bubble of the mid 2000s. Less people are living in these bigger and better houses.
Have comments? Join the conversation on Twitter.
Disclaimer: The content on this site is for general informational and entertainment purposes only and should not be construed as financial advice. You agree that any decision you make will be based upon an independent investigation by a certified professional. Please read full disclaimer and privacy policy before reading any of our content.


