UPFINA's Mission: The pursuit of truth in finance and economics to form an unbiased view of current events in order to understand human action, its causes and effects. Read about us and our mission here.
Reading Time: 5 minutes
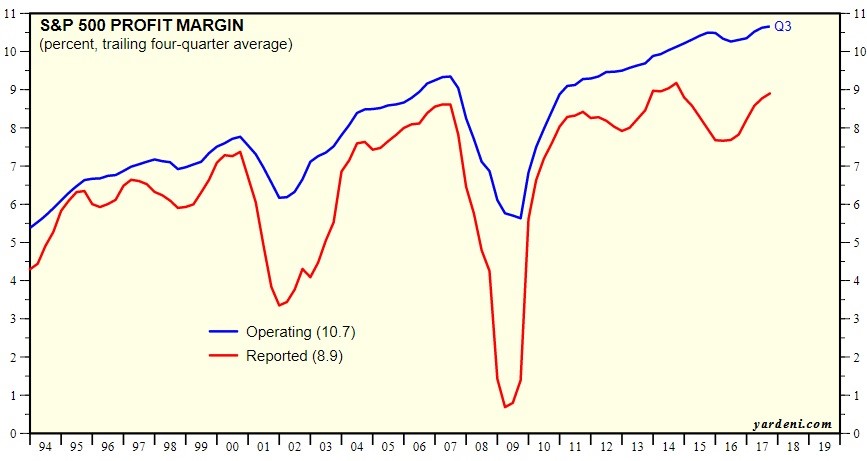
S&P 500 profit margins are a pivotal topic to discuss when forecasting the overall market’s direction. It’s traditionally thought that margins are cyclical and mean reverting metrics. This means they go up and down. When they go up, it’s expected they will fall and when they go down, it’s expected they will rise. The chart below shows the 4 quarter trailing average of operating margins and the 4 quarter trailing average of reported margins.
Profit Margins Are At Record Highs
Operating margins are at their record high and reported margins are near their record high. This makes you think that stocks will have a sharp decline when the cycle corrects because when margins mean revert, profits fall.
This logic ends up failing because different sectors have different margins. The stock market of 2017 is not like the one in 2000. Technology has become the largest contributing sector to earnings and it has high profit margins. In Q3 2017, tech contributed 22.28% to S&P 500 earnings. It had 19.75% operating margins; the S&P 500’s margins were 10.16%. Comparing the tech stocks of today to the dominant sectors of the past makes little sense. It’s possible the assertion that margins mean revert is correct, but just know that for this to happen, some of the high flying segments within tech like software will need to see their margins come down. Therefore, instead of doing a top down analysis and expecting margins to fall because of past action, look at these individual firms to see if competitive threats are growing or falling.
Keep in mind that margins will fall during the next recession. What we’re discussing is how much they will fall and what they recover to. The latest evidence shows them to be in an uptrend while traditional analysis says they are secularly stable and cyclically volatile.
EBITDA Margins Remain Within A Range
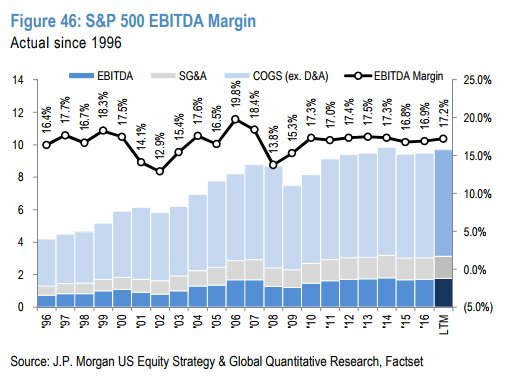
Profit margins are the most prevalent form of the stat, but there are others as investors like to slice and dice metrics in many different ways to learn more about businesses and the economy. The chart below shows EBITDA margins. That is earnings before interest, taxes, depreciation, and amortization.
S&P 500 EBITDA Margins Are Range Bound
EBITDA margins have been confined to a range like traditional analysis says they should be. EBITDA margins being below the two previous cycle peaks suggests that stocks have high profit margins because non-operating costs have fallen. This means profit margins are high because interest expenses are low and tax rates are low. Depreciation and amortization expenses are average.
Usually EBITDA isn’t thought of highly because the concept of removing ‘the bad stuff’ is unrealistic. However, in this case, it has shown us why profit margins are so high. We still stand by the notion that changes in the sector weightings affect historical margins. In fact, the types of firms in the index determine the amount of interest, taxes, depreciation, and amortization. This important point we’re focusing on is whether the latest improvement in profit margins, which looks secular by just glancing at the chart which has higher highs, is stable or based on cyclical trends. This determines whether margins can keep going higher. There’s always going to be some limit to margins because of competition. The question is if margins will stay near the high end of their historical range.
Interest, Taxes, Depreciation & Amortization
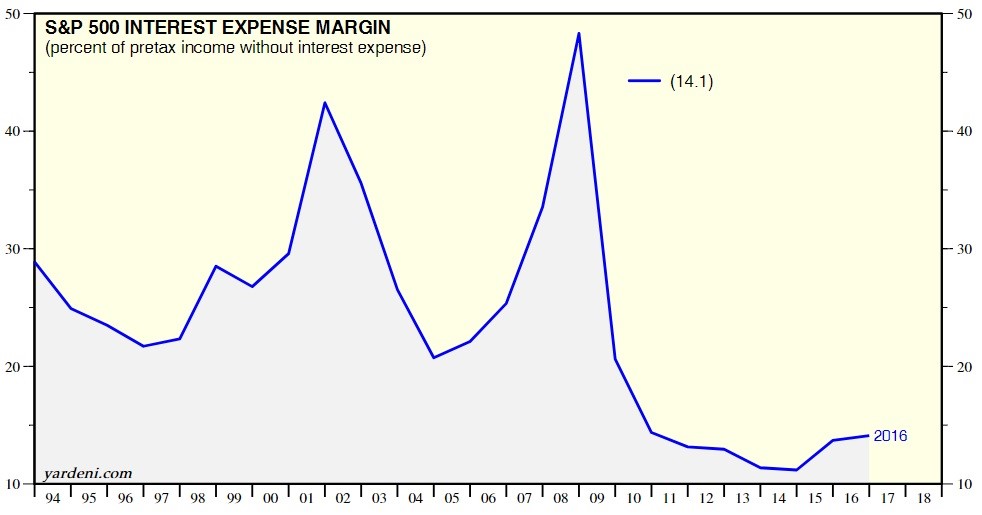
Interest rates have fallen to the lowest point in human history in this business cycle. Low interest rates help ease financing costs. As you can see from the chart below, the interest expense margin firms have been paying this cycle has been lower than the previous two. This helps drive profit margins higher and explains the difference between profit margins and EBITDA margins.
Interest Expenses Are Low
If profit margins are driven up by low borrowing costs, it means they are cyclical. The reason why it’s confusing to look at this is because this cycle of declining interest rates has lasted decades. It’s the long term business cycle that sets the trend, while the short term cycle tests the ranges of that trend. If interest rates were to rise, creating a new long term cycle, profit margins wouldn’t remain high. The determining factor is if you think this long term interest rate cycle can continue for a prolonged period of time.
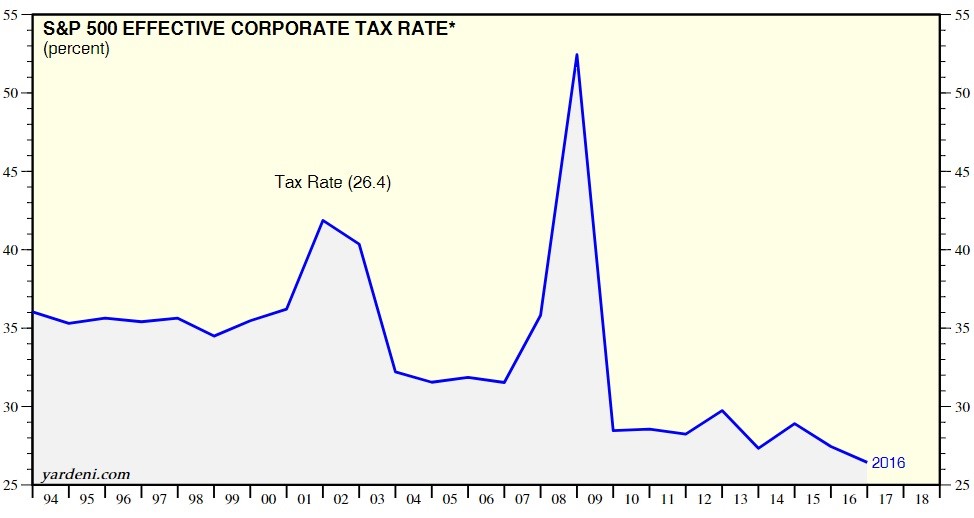
Forget about the statutory corporate tax rate of 35% which existed until 2017. Effective tax rates are low on a historical basis. The tax rates paid by corporations had been falling for years. The chart below shows the effective corporate tax rate paid by S&P 500 firms from 1994 to 2016.
Corporate Tax Rates Were Falling Before The Tax Cut
The chart bolsters the case of those claiming a corporate tax cut wasn’t necessary. This is because while America’s statutory tax rate was globally noncompetitive, the falling tax rate actually paid, made the situation far from dire. Taxes paid are secular and cyclical. The secular trend in taxes is that firms will always get better at avoiding taxes as long as the laws stay the same. The cyclical trend in tax rates depends on inequality and political trends.
While it’s difficult to know when the interest rate cycle will turn, it’s pretty easy to see that for the next few years, the corporate rate tax paid will be low, supporting profit margins. The statutory rate was lowered from 35% to 21%. As you can see from the chart below, the GOP tax plan shrinks the taxes paid by corporations every year from 2018 to 2027.
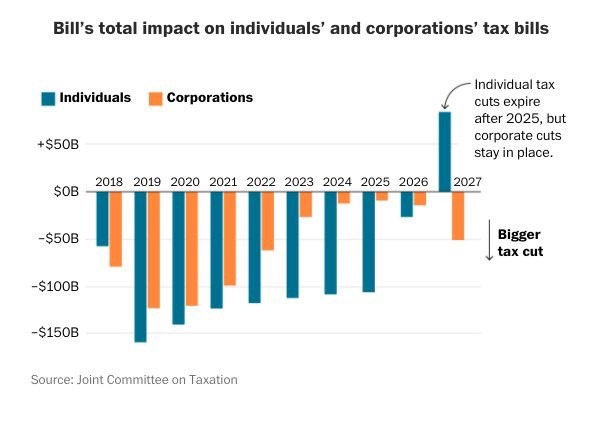
GOP Tax Cut Lowers Corporate Tax Rates Further
As we mentioned, depreciation and amortization expenses are average compared to historical standards. If you compare this current cycle to the high margin years in the previous cycle, D&A expenses are higher now. If you compare this cycle to the 1990s expansion, D&A is lower. As you can see, D&A hasn’t been the main driver of the wedge between EBITDA margins and profit margins.
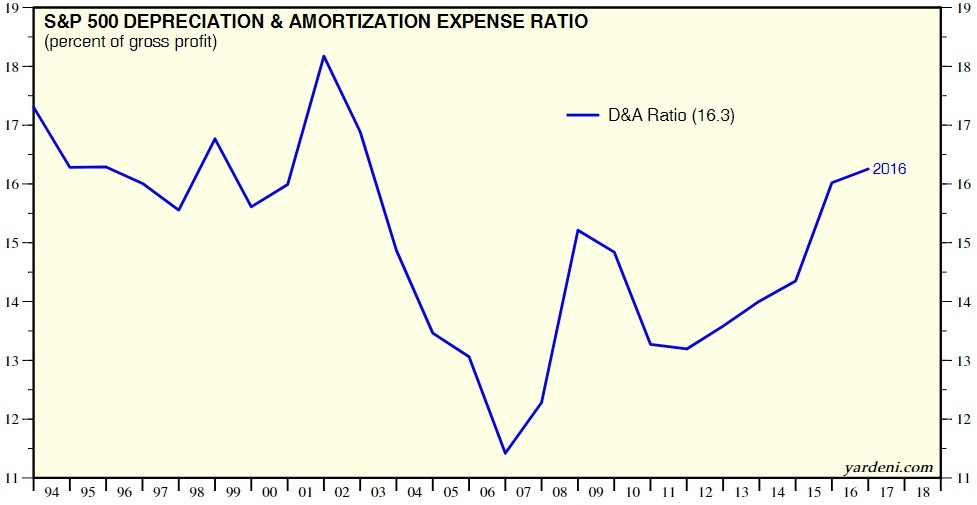
Depreciation & Amortization Expense Ratio Is Average
Conclusion
The goal of this article was to give you a better picture of where margins are headed in the next few business cycles. The size of the decline in margins in the next recession depends on how large the recession is and which sectors it affects the most. Obviously, margins have a lot of room to fall, but that doesn’t mean stocks will have a massive correction like the last two cycles. In addition we pointed out the variables you need to predict to determine if margins push to new heights in the next few expansions.
Have comments? Join the conversation on Twitter.
Disclaimer: The content on this site is for general informational and entertainment purposes only and should not be construed as financial advice. You agree that any decision you make will be based upon an independent investigation by a certified professional. Please read full disclaimer and privacy policy before reading any of our content.


