UPFINA's Mission: The pursuit of truth in finance and economics to form an unbiased view of current events in order to understand human action, its causes and effects. Read about us and our mission here.
Reading Time: 5 minutes
The yield curve potentially inverting continues to be the most covered story in the financial press in 2018 (outside of the tariffs). The biggest misnomer about the yield curve has been that a flattening curve is a warning sign of impending decline in asset prices; it falsely implies you should sell ahead of the inversion. It’s a thesis which is based on the false assumption that the curve is concurrent rather than a leading indicator. As of July 18th, when the difference between the 10 year treasury yield and the 2 year treasury yield was 25 basis points, the only area hurt by the curve is the bank stocks because they borrow short and lend long. We’ve seen some weakness in the traditional line of business from the large banks in Q2. This is a small issue compared to the potential for a recession after the curve inverts.
The chart below alleviates any fear of a flattening yield curve. It shows the next 500 trading days following the descending of the yield curve from where it was on July 11th.
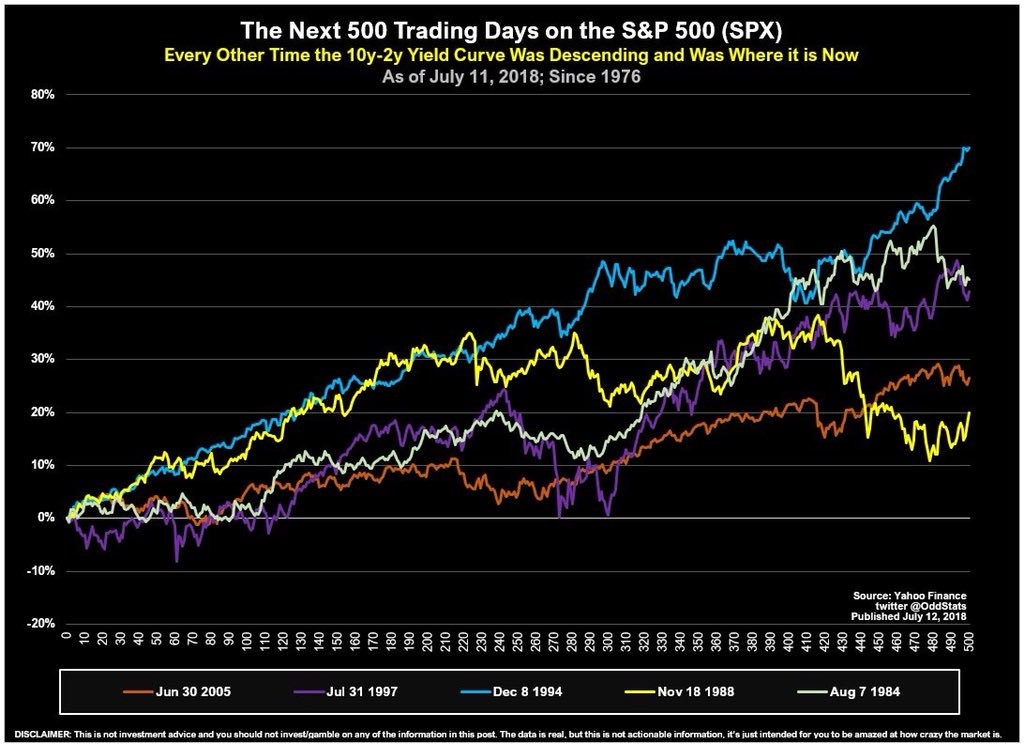
Source: Twitter @oddstats
To be clear, the difference between the 10 year and the 2 year was 27 basis points on July 11th. The past few cycles have seen nothing but upside for equities in the 500 days after that point in the cycle. There’s no need to sell stocks now on this merit alone. You should be watching and formulating an action plan for when the inversion occurs. After the inversion, you want to pay close attention to the economic indicators and become cautious at the first sign of weakness. Unlike past episodes of cyclical weakness in this expansion, one after the inversion should be approached with extreme caution.
A Global Inversion
The American yield curve isn’t the only one that is flattening. The chart below shows the German, Japanese, Canadian, and U.K. curves have all flattened.
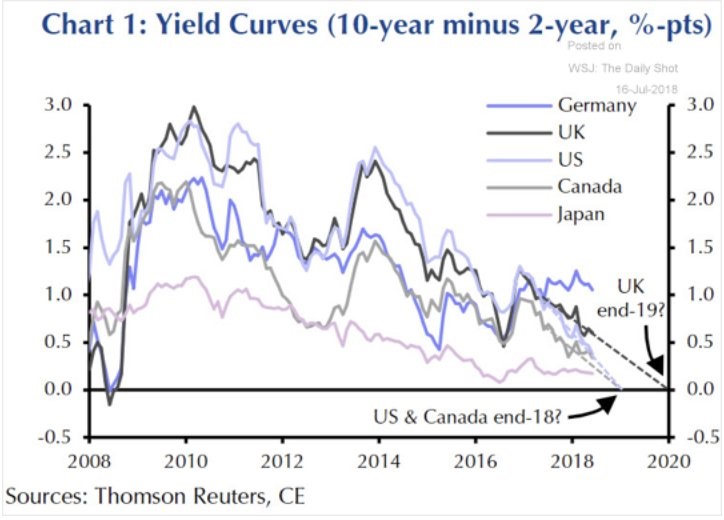
Source: The Daily Shot
This is noteworthy because America is much further along on its hike cycle than the other nations. The Fed hikes have pushed up the short end of the curve, which will cause an inversion. The European Central Bank and the Bank of Japan both have negative rates. The Bank of England has rates at 0.5%. The Bank of Canada started raising rates in 2017; its rates are now at 1.5%. With the Fed funds rate between 1.75% and 2%, it makes sense to see America and Canada closest to an inversion. US GDP growth has been strong in Q2, even though the country has tight monetary policy, because of the increase in deficit spending and the tax cuts on the fiscal policy side. The chart above assumes that the Fed will invert the yield curve by the end of 2018. That is trend extrapolation. Changes to inflation, economic growth, or Fed policy could alter that time frame.
Interesting Thoughts On The Curve
It’s inconsistent to say the Fed needs to keep the curve normal to avoid a recession because a normal curve implies the Fed will raise rates. The Fed can’t always raise rates. This explains why it’s difficult for the Fed to control the yield curve since they only impact the short end of the curve, not the long end. The curve flattening implies the Fed is getting closer to ending its rate hike cycle. Keep in mind, that the Fed is worried about inflation and the unemployment rate. If inflation is increase, the Fed can’t stop hiking rates on account of the curve flattening.
It’s fair to say the Fed shouldn’t hike rates now because inflation isn’t strong; we’re counteracting the narrative that the Fed can and should create a scenario where there is no business cycle and growth lasts forever. Some investors and economists put way too much stock in what the Fed can do. The Fed often is moved by the market and is reactionary in nature. It’s not easy to get outside of the box the market puts the Fed in when it sets policy. This is why forward guidance is important as it helps alter the Fed funds futures market.
Is An Inversion Bad?
Let’s preface this discussion by saying that every time the yield curve inverts, there are naysayers who claim there won’t be a recession soon afterwards. Just because these arguments used against the yield curve have been wrong doesn’t mean they can’t be discussed. Every angle should be discussed because markets are always changing. One interesting game theory perspective about markets is that once an economic metric becomes a metric, it ceases to be predictive either because it is altered or because it is so focused on, it is already priced in. Think about it this way. If you’re expecting the yield curve to help you time the cycle when every financial professional follows the curve religiously, it will not give you an investment edge.
One argument against the yield curve is that the term premium is lower now, so the curve doesn’t matter. That’s a very fancy argument because the term period isn’t understood completely. To be clear, the term premium is the difference between locking up your money in a long term instrument versus rolling it over in a short term instrument. The chart below refutes the point that the curve doesn’t matter because of the declining term premium because it shows the term premium fell in past cycles while the inversion still correctly forecasted recessions.
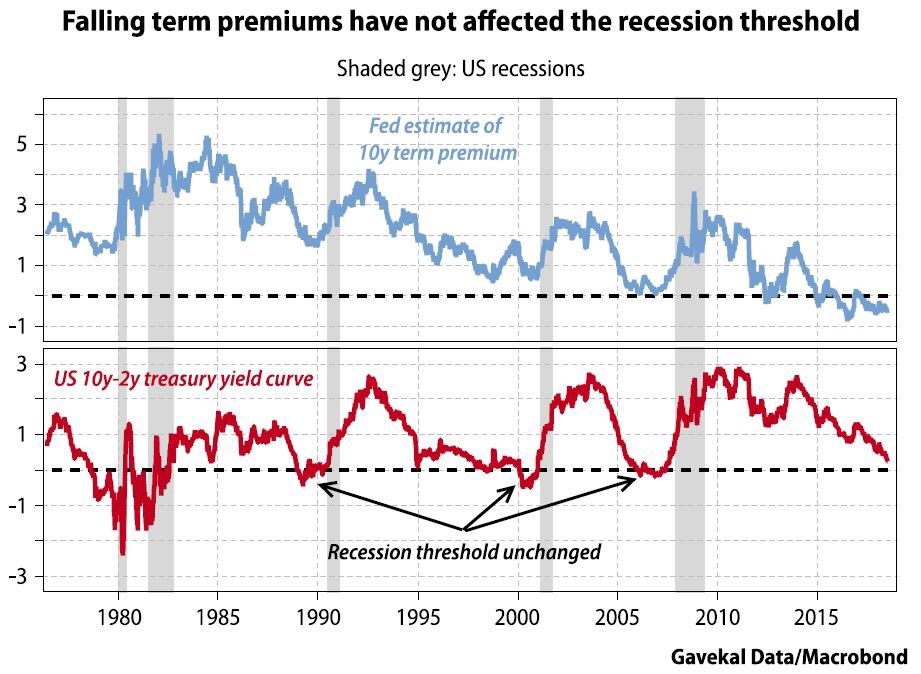
Source: Macrobond
Another argument against the yield curve is that the short term spread is more accurate in predicting recessions than the long term spread. One way of expressing this is to say the difference between the 3 month bill spot price and the forward 18 month is more accurate than the 10 year 2 year spread. The chart below shows the chance of a recession calculated by using a long term and a short term spread model.
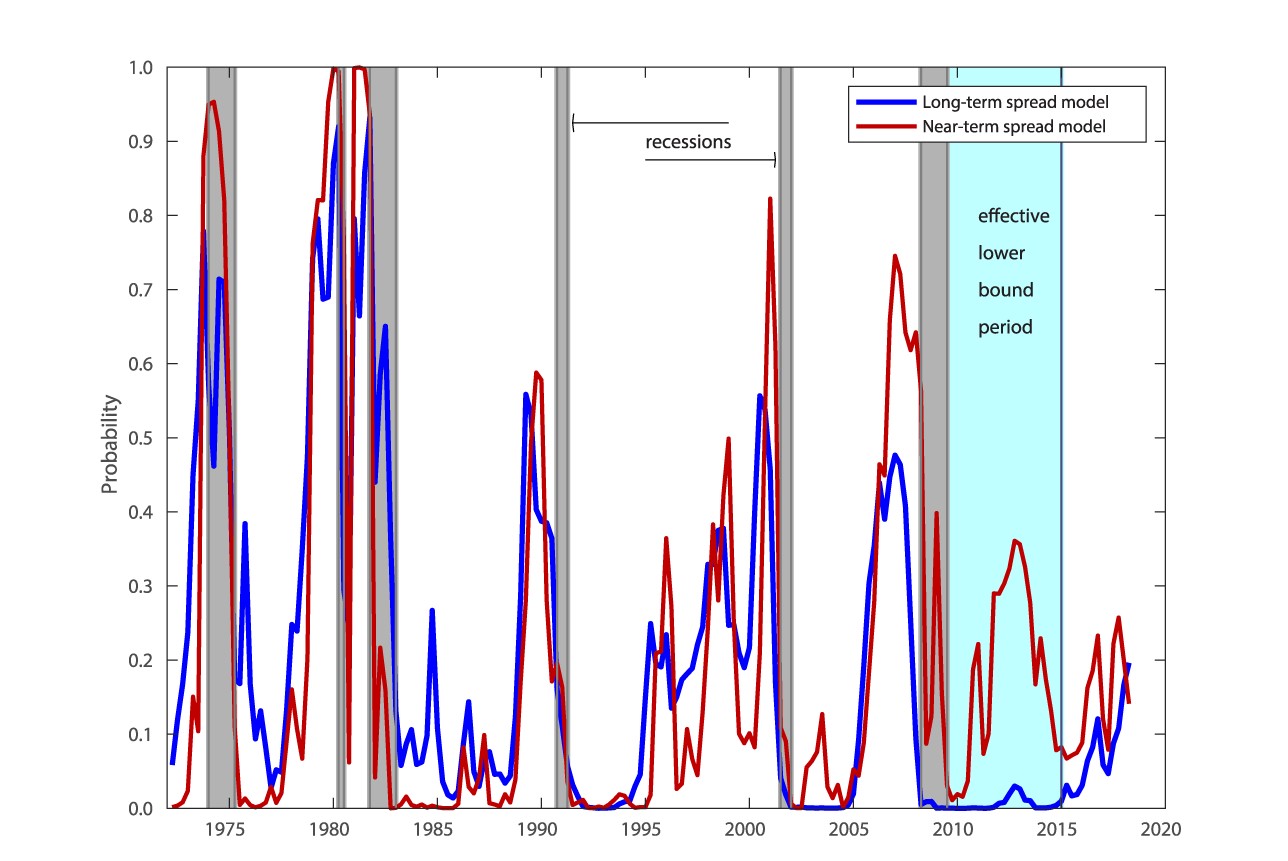
Source: Federal Reserve
The Fed believes the near term spread model has more merit. This model implies the chance of a recession is dropping, not increasing like the long term spread suggests.
Conclusion
It was easy to see that a flattening curve didn’t mean stocks should be sold. It’s more difficult to determine if an inversion spells the end of this bull market in the next few quarters. The good news is we will be discussing this topic often to give you the tools to make better investing decisions as the inversion approaches. The bad news is you will need to decide for yourself after reading good arguments on both sides of the debate. We’ll be reviewing the economic data to best assess the probabilities for future outcomes in order to be prepared to make practical decisions, not just a theoretical discussion. The final point we’ll make is a bear market can start at any time near a recession. It’s even possible for a bear market to start right after a yield curve inversion if everyone starts to sell after this catalyst because they know it means a recession is coming soon.
Have comments? Join the conversation on Twitter.
Disclaimer: The content on this site is for general informational and entertainment purposes only and should not be construed as financial advice. You agree that any decision you make will be based upon an independent investigation by a certified professional. Please read full disclaimer and privacy policy before reading any of our content.


