UPFINA's Mission: The pursuit of truth in finance and economics to form an unbiased view of current events in order to understand human action, its causes and effects. Read about us and our mission here.
Reading Time: 5 minutes
Everyone wants to know when the labor market will hit full employment because the jobless claims and unemployment rate have been signaling the labor market has been full for over a year. The unemployment rate is 4%. The average trough in the unemployment rate in the past 10 business cycles is 4.5%. The unemployment rate hit 4.5% in March 2017. Furthermore, the jobless claims to population ratio hit a record low this cycle.
These traditional measurements signal an expectation of big nominal wage growth and a full labor market. However, as we detailed recently, real wage growth has been nonexistent. The nominal average weekly earnings growth of 3% isn’t terrible, but it’s not as high as you’d expect. The weekly wage growth was 4% in May 2007 when the unemployment rate was 4.4%. We now have a lower unemployment rate and lower wage growth. You would expect wage growth to be increasing significantly if you solely looked at the jobless claims to population ratio.
There are two important points to keep in mind while economists and the financial press obsess about whether the labor market is full and a recession is impending in the next 1-2 years. First, the labor market doesn’t need to be full for there to be a recession. The mini recession from mid-2015 to early 2016 occurred when the labor market was less full than it is now. In April 1981, the unemployment rate bottomed at 7.2% and a recession occurred a few months later. The labor market doesn’t need to be tight for a recession to occur. The second point is something we’ve discussed often in our labor market articles. The prime age labor participation rate is still signaling the labor market has about 2-3 years of slack left before it gets tight. The quick job creation in 2018 is evidence that the labor market isn’t nearly full.
Do People Want Jobs?
We often discuss how the prime age labor participation rate is low. Now it’s time to add some color to that discussion to help you contextualize the situation, allowing you to forecast future changes in the rate and the overall labor market. The Bloomberg chart below shows the prime age unemployment rate for those who want a job and those who don’t want a job now.
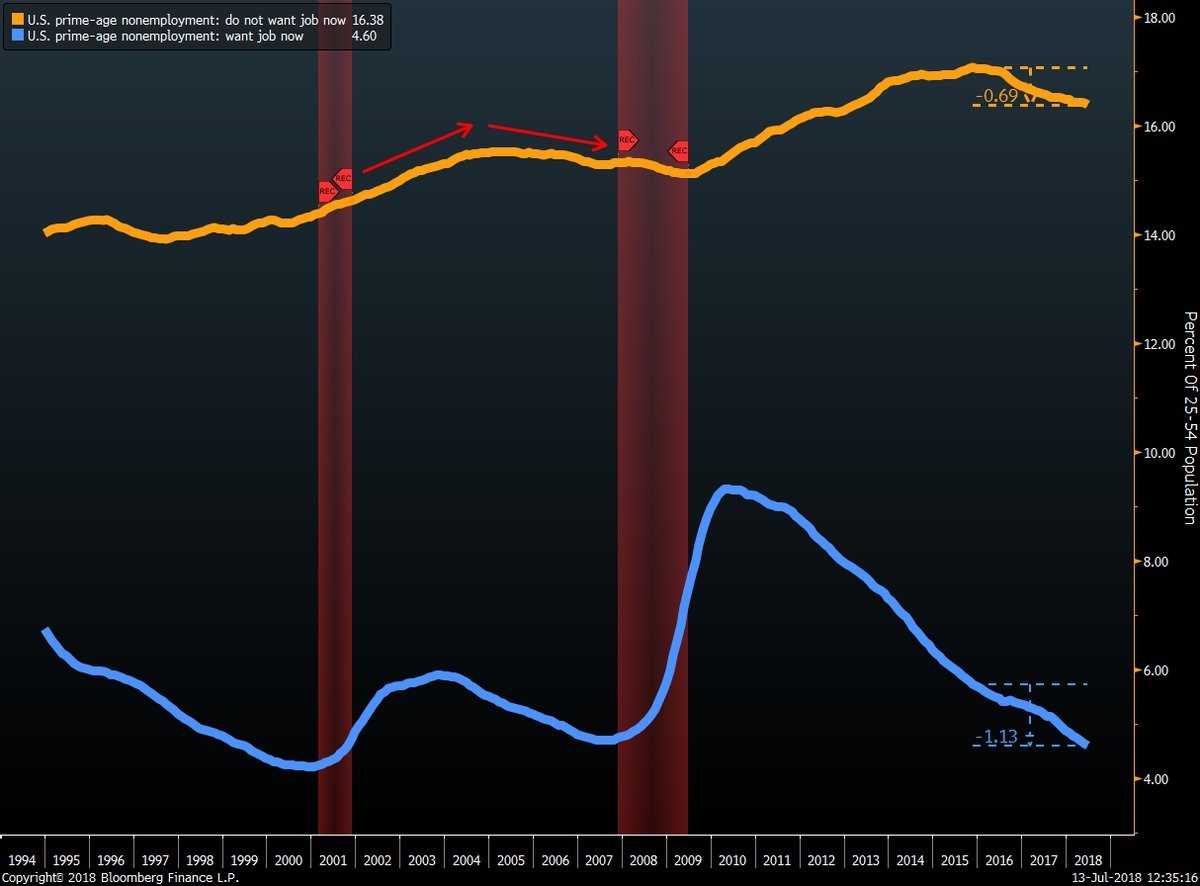
Source: Bloomberg
The key point to review is the relative performance. The unemployment rate for those who want a job now started falling soon after the recession. The rate kept rising for those who didn’t want a job because the labor market was loose.
The recent change in the past 2.5 years is that 40% of the increase in employment is coming from people who don’t want a job now. This is consistent with the JOLTS report which shows the number of job openings is greater than the number of people looking for a job. This indicator and the decline in the unemployment rate of people who don’t want a job now show the labor market is late in the cycle. These workers who don’t want a job now represent the excess slack in the labor market. The good news is there’s still room for the rate to fall before the pre-2008 recession level is reached. This means there is still a few quarters left of people coming off the sidelines, preventing a worker shortage.
Trucker Shortage
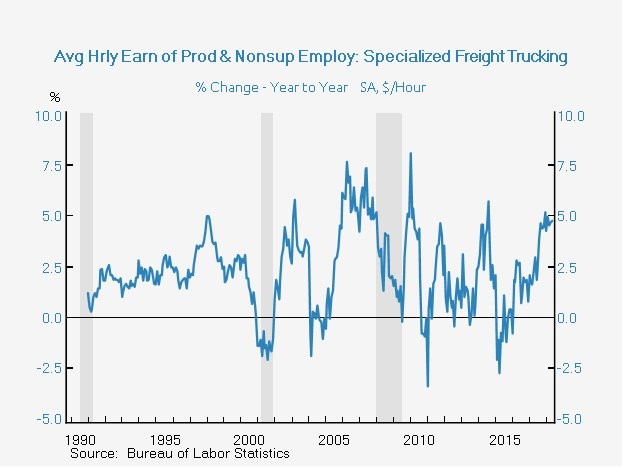
Since this is a measurement of the entire labor market, we can’t account for the industries which have a shortage now and the industries which won’t create enough jobs even as the overall labor market gets tighter in the next few quarters. The labor market isn’t one market; it’s hundreds of small markets working somewhat independently. One example of an industry which has a labor shortage is trucking. Getting into the point about people who don’t want a job, working as a trucker isn’t appealing for many regardless of the pay because truckers work long hours and are away from their families for long stretches of time.
The general freight trucking wage growth isn’t remarkable, but when you dig down to the specialized trucking industry, which includes movers, the average hourly wage growth gets higher as it’s close to 5%.
Source: Twitter @ernietedeschi
Even though the labor market has been expanding since 2010, this industry has had bouts of weakness where wages shrunk, showing how every market is unique and isn’t always correlated with the overall labor market.
Reasons For Unemployment
Wanting a job or not is one factor which effects the participation rate. The charts below break down the historical reasons for not participating in the labor market for prime age men and women.
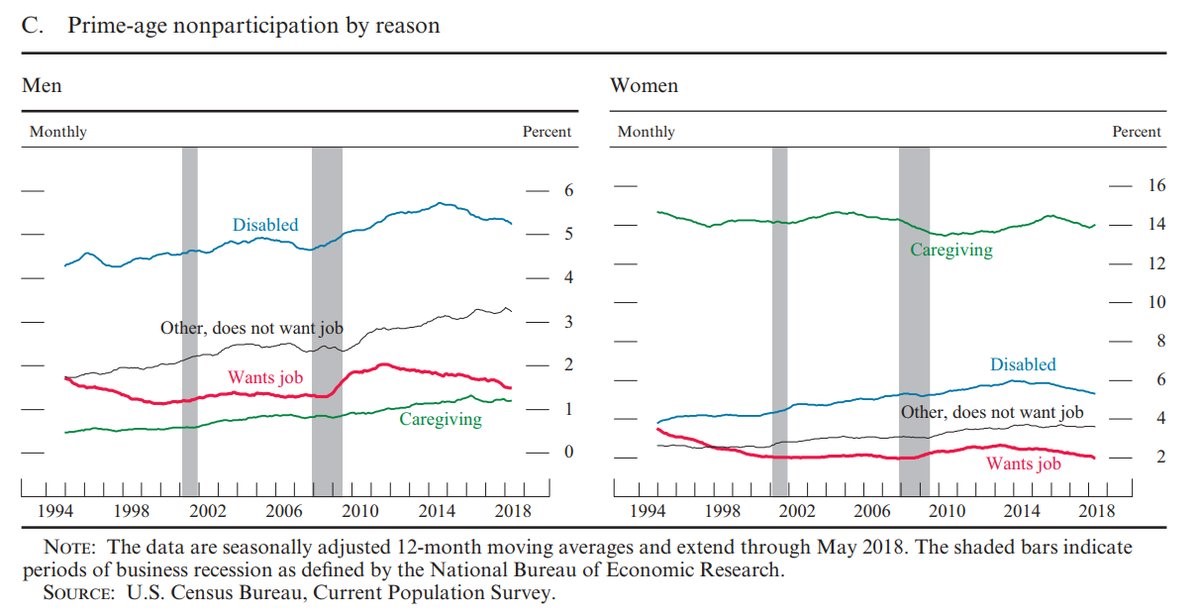
Source: Federal Reserve
The disabled rate is cyclical because either jobs become more open to the disabled when employers need workers or because workers fake an injury until they can get a job. Men often work at more dangerous jobs such as construction, so their disability rate is much higher than women’s rate. It’s amazing to see that the disability rate for men was 1.6% in 1968. It hit 6% in 2014. The chart above only shows data since 1994, so it excludes the massive decline in women citing care-giving as reason for not working. In 1968, 40.2% of women didn’t work because they were caregivers. Now it’s near 14%. It has been more stable in the past 25 years than from 1968 to the early 1990s.
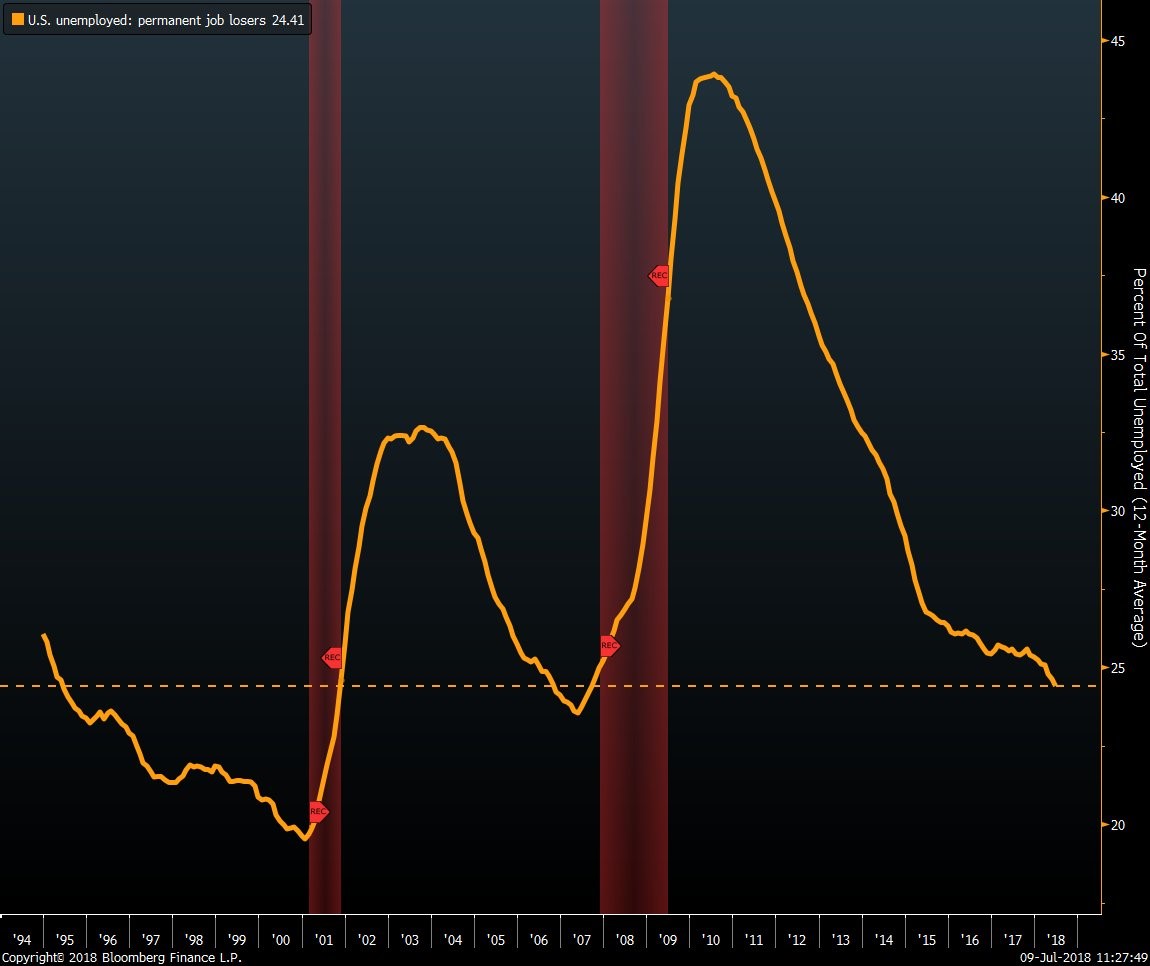
Permanent Job Losses
Another way to look at the labor market is to review the permanent job losses. As you can see from the Bloomberg chart below, the rate fell from nearly 45%, after the recession, to the current rate which is 24.41%.
Source: Bloomberg
The Fed thought the long run unemployment rate was high in the early days of the recovery because they thought these workers were gone from the labor market. The permanent job losses rate is near the level it declined to at the end of last cycle, but it has plenty of room to fall further to reach the level it declined to in early 2001.
Conclusion
The elephant in the room when it comes to people not getting a job is incarceration. As you can see from the Deutsche Bank chart below, 1 in 3 Americans are arrested by the age of 25 for non-traffic violations.
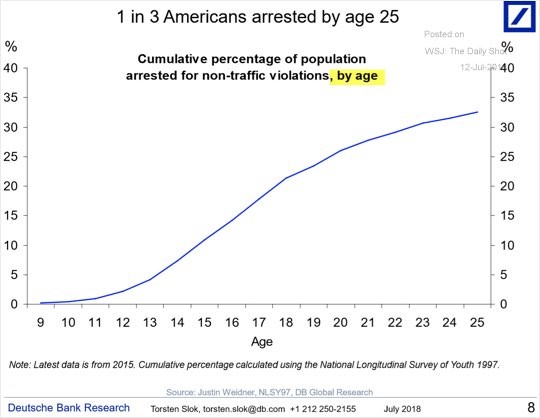
Source: Deutsche Bank
Lowering the incarceration rate by decriminalizing drugs is one way to increase the labor participation rate. This article aimed to explain the nuances in the participation rate (especially for prime workers) because it is one of the most important topics to understand when reviewing the labor market.
Have comments? Join the conversation on Twitter.
Disclaimer: The content on this site is for general informational and entertainment purposes only and should not be construed as financial advice. You agree that any decision you make will be based upon an independent investigation by a certified professional. Please read full disclaimer and privacy policy before reading any of our content.


