UPFINA's Mission: The pursuit of truth in finance and economics to form an unbiased view of current events in order to understand human action, its causes and effects. Read about us and our mission here.
Reading Time: 5 minutes
As of the May PCE report, core inflation is at the Fed’s target of 2%. The PCE report is usually confirmation of what we already know because it comes out about a month after the time period it’s telling us about. The June PCE report doesn’t come out until July 30th. Therefore, the PPI-FD and CPI reports are very important as they give us the first hard data look at inflation. The regional Fed reports, and the ISM have price indexes, but they aren’t always accurate and can be volatile. A big reason we focus on inflation is because it affects Fed policy. Hence, hard data reports are more important than usual because it’s what the Fed focuses on. Currently, there’s a 62% chance the Fed hikes rates at least 2 more times this year. The hikes are expected to come in September and December.
The PPI-FD gives us a picture of the producer price inflation which is an early warning sign of where consumer prices could be headed.
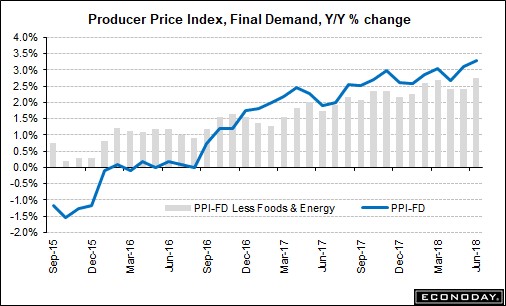
Source: Econoday
Either producers pass down the costs to consumers or accept lower profit margins. The June PPI report was strong as most indicators showed an acceleration in price appreciation. Month over month PPI was 0.3% which beat estimates by 0.1% and year over year PPI was 3.4% which as 0.3% higher than May. Without food and energy, core PPI was up 0.3% month over month, meeting estimates. Year over year it was up 2.8% which was 0.4% better than the prior month. Without food, energy, and transportation, inflation was 0.3% month over month and 2.7% year over year.
With the tariffs affecting aluminum and steel first, everyone has their eyes on the pricing of those commodities to see how the future tariffs will affect prices. Steel and aluminum price appreciation decelerated in June. Steel price growth was 1.9% month over month in June after increasing 4.3% in May, 3.2% in April, and 1.9% in March. Aluminum prices were up 2.1% in June after increasing 5% in May, 1.8% in April, and 2.1% in March. Clearly, there was a significant increase in demand to buy steel and aluminum before the tariffs went into effect and to a lesser extent after. The one issue which complicates analysis is that the tariffs first went into effect on March 23rd, but they were implemented on June 1st for Europe and Canada after being delayed for negotiations that never amounted to anything. Either way you look at the data, this is a significant appreciation in price in the past four months.
Energy, gasoline, and heating oil prices were up 0.8%, 0.5%, and 8% month over month, since June included the volatility in oil prices associated with the OPEC decision. Food brought down inflation as prices were down 1.1%. The 13.8% decline in vegetables and the 2.1% decline in food exports brought food prices lower. Car prices were up 0.4% and light trucks were up 0.6%.
CPI Report Mostly Met Estimates
Even though PPI was high, the CPI report was near expectations, implying a potential margin compression for the firms facing rising costs. The month over month headline CPI was up 0.1% which was below estimates for 0.2%. Year over year CPI was up 2.9% which met estimates and was 0.1% higher than May. Core CPI, which excludes food and energy, was up 0.2%, meeting estimates and last month’s number. The only beat was year over year core CPI which was 2.3%. The expectations and last month’s core inflation were 2.2%. A big cause of the increase in both year over year core and headline inflation were the easy year over year comparisons shown by the green arrow below.
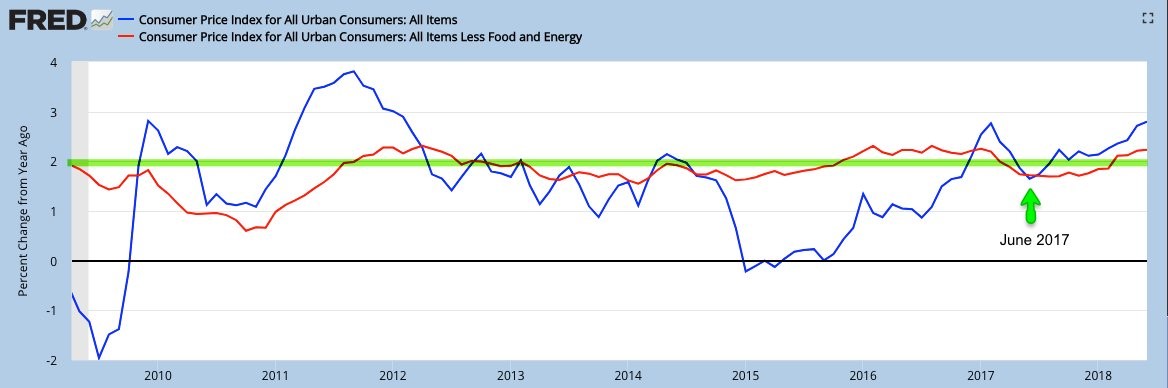
Source: FRED
These easy comparisons explain why the bond market isn’t enamored with the high levels and the Fed’s guidance hasn’t changed much (the change from 3 to 4 hikes in 2018 was a one vote shift).
Medical care was up 0.4% month over month and 2.5% year over year. New car and light truck prices were up 0.4% and used vehicle prices were up 0.7%. Housing was unchanged. “Away from home costs” were down 3.7% and owners’ equivalent rent was up 0.3%. The rental inflation component of the U.S. consumer price index being at 3.58% was the lowest reading since July 2015. Energy prices were down 0.3% unlike what was seen in the PPI report. Food prices were up 0.2%.
Treasury Market Not Buying Growth And Inflation Narrative
As we mentioned, the Treasury market sees right through the high inflation prints as yields on long bonds haven’t budged much in the past few months. From mid-February to mid-July the 10 year yield moved somewhat, but ended at the same spot which was about 2.86%. The TIPS breakeven rate is a market based measurement of inflation which is based on the inflation protected treasuries. As you can see from the 5 year TIPS breakeven chart below, the inflation expectations haven’t changed much in the past 6 months even as the year over year inflation stats have increased.
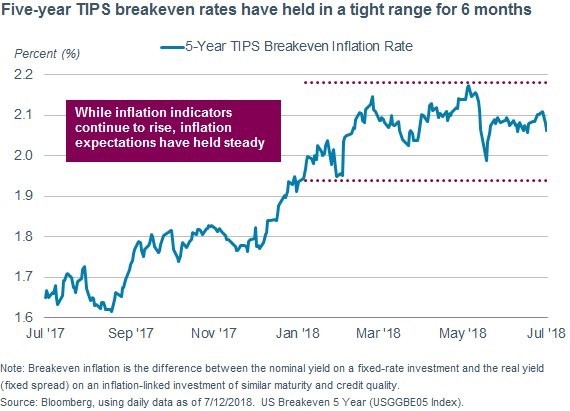
Source: Bloomberg
Ugly Side Of Inflation
Inflation isn’t that high, but nominal wage growth is missing estimates which means real wage growth is declining. We recently covered the topic of real wage growth in depth in Real Wage Growth Usually Weak Before Recessions. The Bloomberg chart below shows the real hourly earnings were 0% as of June.
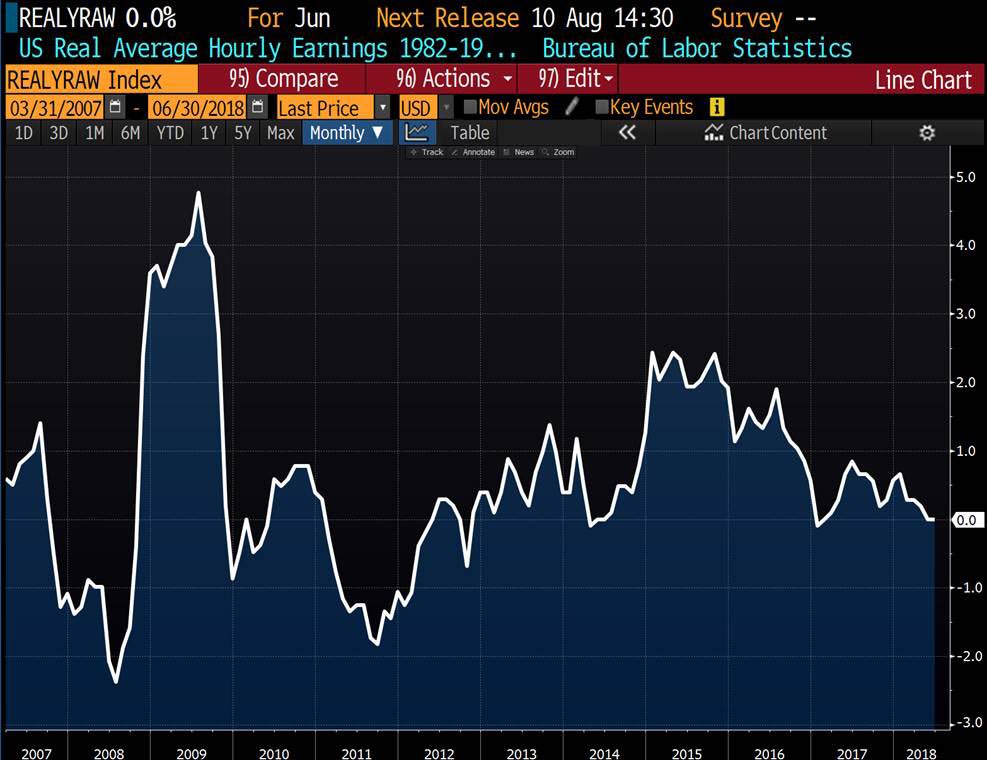
Source: Bloomberg
In June, the seasonally adjusted CPI was 2.8% and hourly earnings growth was 2.7%, meaning this metric was slightly negative (-0.05495%). Using the weekly earnings growth which was 3%, the real wage growth was only 0.2%. Both are not great for American workers.
UIG Wrong Comparison
The best comparison to the NY Fed’s Underlying Inflation Gauge is headline CPI and PCE, not core CPI and PCE.
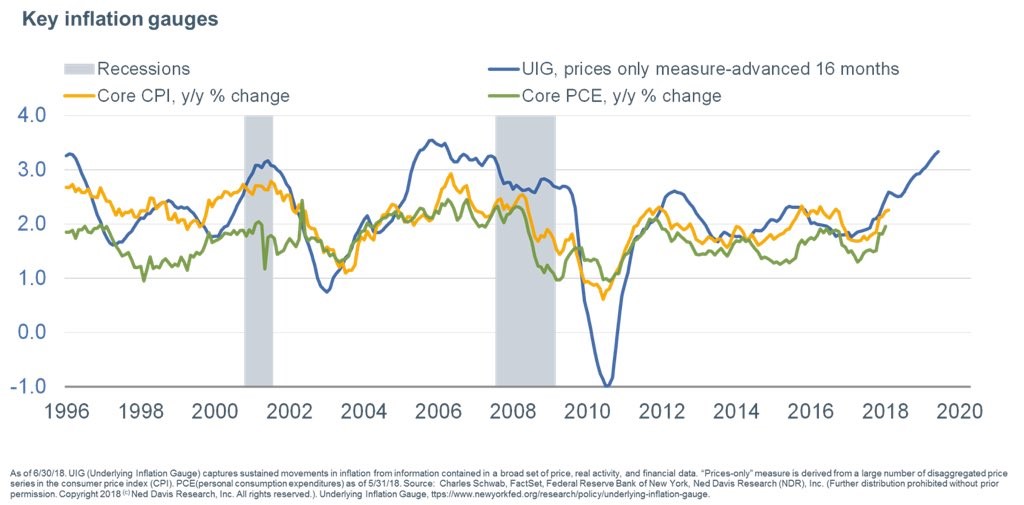
Source: NY Fed
The current UIG expects trend CPI to be between 2.3% and 3.3%. The chart above implies core PCE could get above 3% in the next year, which is highly unlikely. When the year over year comparisons get tougher, inflation might fall. Core PCE above 3% would cause the Fed to start hiking quicker, thus bringing the risks of a recession closer.
Conclusion
The Fed is at odds with the 10 year bond yield because the bond isn’t expecting big inflation or GDP growth acceleration even though the Fed is raising rates, pushing up the short end of the curve. The Fed has a symmetric policy, but even with its 4 rate hikes in 2018, policy is getting contractionary. With the year over year inflation rates mainly up because of easy comparisons, we’d say the risk of the Fed being too hawkish is higher than the risk of it being too dovish, meaning a recession could be a growing risk for investors and markets.
Have comments? Join the conversation on Twitter.
Disclaimer: The content on this site is for general informational and entertainment purposes only and should not be construed as financial advice. You agree that any decision you make will be based upon an independent investigation by a certified professional. Please read full disclaimer and privacy policy before reading any of our content.


