UPFINA's Mission: The pursuit of truth in finance and economics to form an unbiased view of current events in order to understand human action, its causes and effects. Read about us and our mission here.
Reading Time: 5 minutes
Housing has been one of the biggest inflationary costs this business cycle as there has been problems creating enough affordable housing (apartments) in cities because of zoning restrictions. Housing has been boosting core PCE, making it a key driver in the Fed’s decision to raise the fed funds rate. A plausible argument to make is that inflation caused by zoning restrictions isn’t going to be directly solved by monetary policy, but if that’s the case, there really aren’t many prices that are solely affected by monetary policy. The core PCE already removes energy and food. Further removing goods and services from inflation metrics which see prices rise for extraneous reasons that are not necessarily related to monetary policy would leave policy makers with little information to examine when making decisions. The Fed looks at the reasons prices increase to find temporary price changes like when Yellen claimed the decline in the price of wireless services was short lived in 2017. However, the increase in housing costs hasn’t been short lived, which adds to the argument that it shouldn’t be ignored.
Houses Getting Bigger
There is no question that zoning laws decrease the number of affordable housing which increases homelessness and inflation, but that’s not the only cause of house price appreciation. The stories in the financial press about millennials being forced to buy tiny homes because of student loans uses the worst stereotype for millennials and causes readers to get confused about the reality. As you can see from the chart below created by Deutsche Bank, the size of single family houses has increased sharply in the past 25 years.
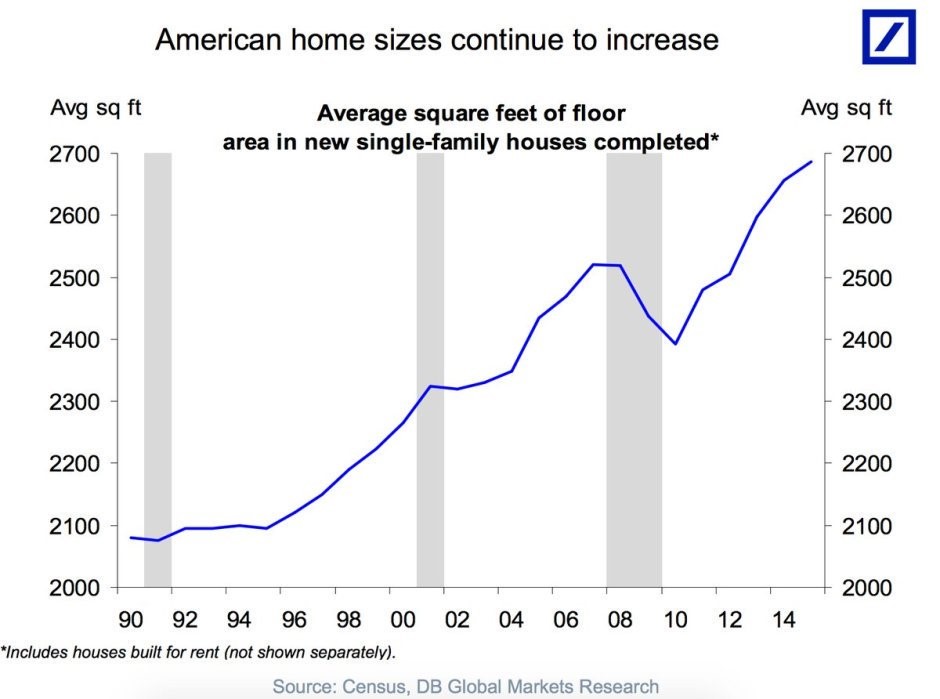
Source: Deutsche Bank
There’s nothing wrong with tiny houses as they are an engineering advancement which allow people to live in a small house cheaply and comfortably. Overall, however, the point is simply that new houses have become larger.
Per Person Housing Size Has Exploded
The data really gets interesting when you also consider the fact that households have shrunk in the past few decades. The chart below from Supply Chen Management shows the average house size has almost tripled since the 1950s.
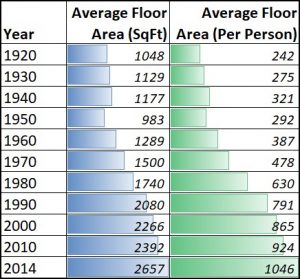
Source: Supply Chen Management
More shockingly, the average square foot per person is up over 4 times the level it was in the 1920s. Even though America has become much more urban in the past few decades, houses have still gotten bigger. As we mentioned, tiny homes aren’t the majority of new houses. If you look at the average square foot per person in 1920, the average person lived in a tiny home (242 sq.ft), with two people living in only 484 square feet.
Median Home Value
Since house sizes have increased significantly, you can’t just look at the price of new houses and say housing would have been a great investment. You also can’t say the millennial generation has it much worse than previous generations.The chart below shows the increase in nominal median house prices, real median house prices, and real median house prices adjusted for the size of house.
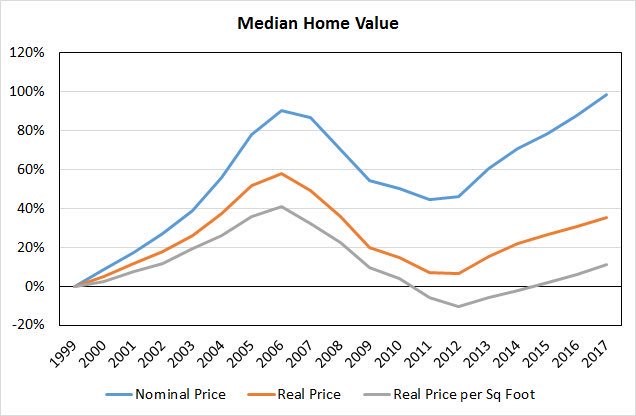
Source: Twitter @EconomPic
Amazingly, house prices are only up about 10%, adjusting for inflation and the size of houses since 1999. That’s in stark contrast to the nearly 100% nominal gain. Yes, some cities have extremely elevated housing costs that you could argue are in a bubble, where there are investor frenzies of flipping homes, but arguing that it is the case for the entire US may not be so plausible with current interest rates.
There’s no question that millennials have rising student loan debt, but in terms of housing, their options aren’t much worse than generation X. Furthermore, buying a house now is a better deal than in the 2000s because there isn’t risk of another housing bust since the mortgage lending standards have improved. By having such high student loan debt and becoming job ready during the financial crisis, millennials have garnered a reputation of being in economic stagnation. This chart gives hope for millennials buying houses and starting families (yes, they still do that, just at an older age).
Wage Growth: Bad Or Good?
As we mentioned, millennials had a rough start to their careers because of the 2008 crisis. This means their wages weren’t great if they could get a job; it was difficult to get one even with a college degree. The question of wage growth applies to Americans of all ages and still confuses economists and workers to this day even as the expansion has been ongoing for over 9 years. The answer to the question about wage growth is that real wage growth in 2018 is weak because of the increase in inflation.
The FRED chart below from The Daily Shot shows the weekly real wage growth for workers employed full time.
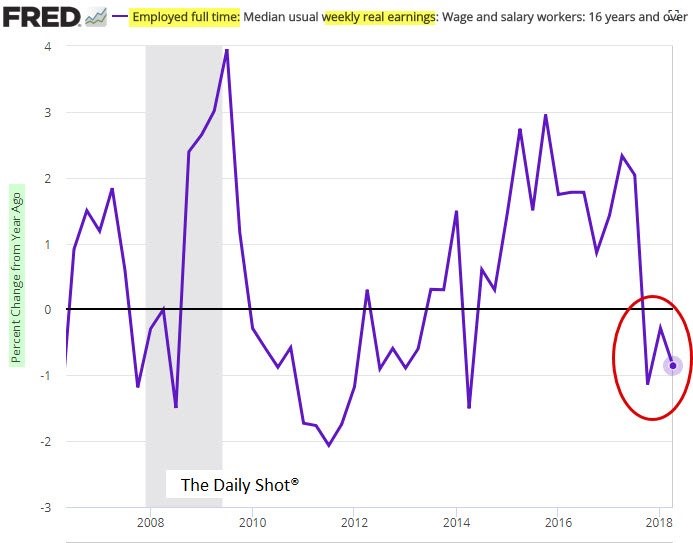
Source: The Daily Shot
Real wage growth was positive during the recession and is now negative. To be clear, recessions aren’t good because job losses mean few are seeing those pay improvements. The best time of this cycle for workers was 2015 and 2016 as the economy saw low inflation, decent job growth, and satisfactory nominal wage growth. A big misnomer is that real wages are supposed to improve late in the cycle. Nominal wages improve, but if inflation grows faster, which it sometimes does, workers don’t get a real pay increase.
Annual real wage growth has actually been great in this expansion. The chart from The Brookings Institution averages real wage growth from the start of recessions to the beginning of the next one.
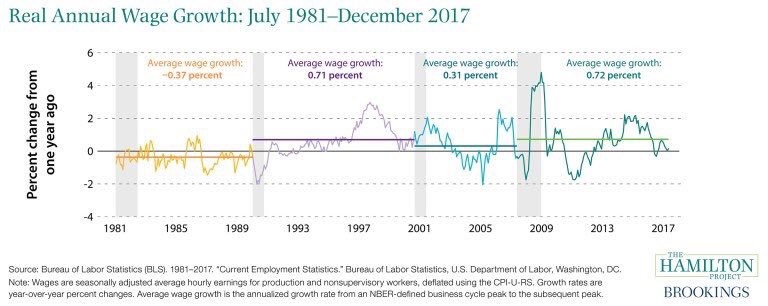
Source: The Brookings Institution
When the data ends in December 2017, real wage growth this cycle has been better than the past three cycles. Since nominal wage growth has been very close to inflation this year, the average for this cycle may end up being below the 1990s growth rate, but it’s still over double the growth rate seen in the 2000s and is about 1% per year better than the declines seen in the 1980s. America is hurt by the recent weakness in real wage growth, but stepping back a few decades helps us contextualize the solid returns since 2009.
Have comments? Join the conversation on Twitter.
Disclaimer: The content on this site is for general informational and entertainment purposes only and should not be construed as financial advice. You agree that any decision you make will be based upon an independent investigation by a certified professional. Please read full disclaimer and privacy policy before reading any of our content.


