UPFINA's Mission: The pursuit of truth in finance and economics to form an unbiased view of current events in order to understand human action, its causes and effects. Read about us and our mission here.
Reading Time: 4 minutes
The common mistake that is made by investors is the belief that markets are always right. If this were the case, no money could be made from participating in markets. The market is a pendulum that is always moving in search of fair value.
There is a bias towards rationalizing market movements because some of the smartest people in the world work in finance. Therefore, when the stock market moves in a direction, market watchers tend to want to be able to explain the movement, even if it doesn’t make sense and is either too optimistic or pessimistic, depending on if its a bull or bear market.
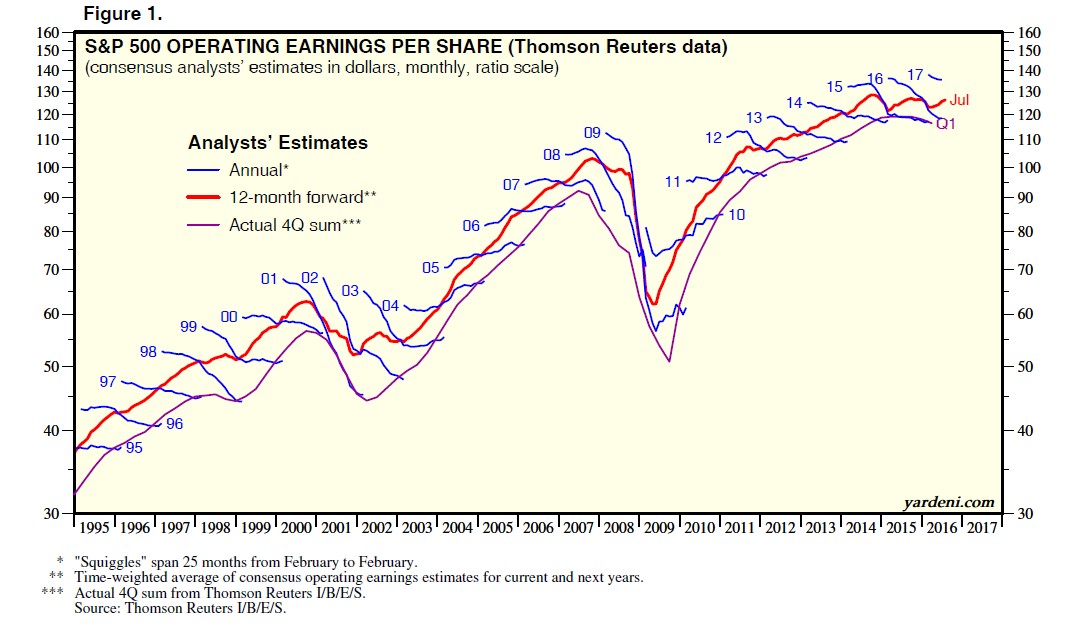
Even though we’ve witnessed a market crash after the technology bubble and the housing bubble, investors manage to repeat the same mistake of relying on analyst analysis. Different financial metrics can be easily manipulated in such a way as to create the desired illusion. In addition, exceptionally high analyst expectations usually aren’t met. These expectations are shown in the chart below.
The blue lines show how analysts’ aggregate yearly S&P 500 earnings expectations change over a 25-month period. The latest earnings stagnation hasn’t been forecasted by analysts as they have a bias towards being positive on the market as it helps their business. Have you ever noticed how few sell recommendations analysts give?
While sell-side (analysts who work for a brokerage firm) research is great, their recommendations are skewed towards the positive side. The most egregious examples of this bias were when Goldman Sachs and Morgan Stanley recommended Tesla stock before working for the firm, making profits on the stock and bond offerings. They have the conflict of wanting to recommend the stock to make money on the next Tesla financial transaction. These types of relationships on Wall Street is what helped contribute to what eventually became the financial crisis in 2008.
Another issue investors must be weary of is paying attention to whether they are looking at bottom up operating earnings or as reported actual earnings. Some firms like FactSet use operating earnings when providing their information. It’s not that operating earnings aren’t a valid metric, but you must recognize that they are higher than as reported data. It’s important to recognize this to make sure you don’t become too optimistic.
To be clear, operating earnings are earnings before interest and taxes. While this result may give you a better perspective on the direction of the business, interest and taxes must be paid which means using the as reported results is the best choice to understanding the company’s financial standing.
Now let’s look at how analysts’ expectations and operating earnings work against investors by examining the latest aggregate earnings data.
While the earnings recession from Q3 2014 to Q1 2016 is over, the aggregate earnings haven’t caught up to the Q3 2014 12-month trailing peak. Even though as reported earnings are expected to improve on a year over year basis from $21.72 to $26.41 (21.6%) in Q1 of 2017, this still doesn’t push the 12-month average higher than the peak. The as reported earnings in Q1 2017 are expected to be $99.24. The peak was $105.96 which means the current 12-month total is 6.3% below the peak.
Even with this decline in earnings, the S&P 500 is up 20.4% in the same period. That shows how expensive stocks have gotten relative to earnings growth.
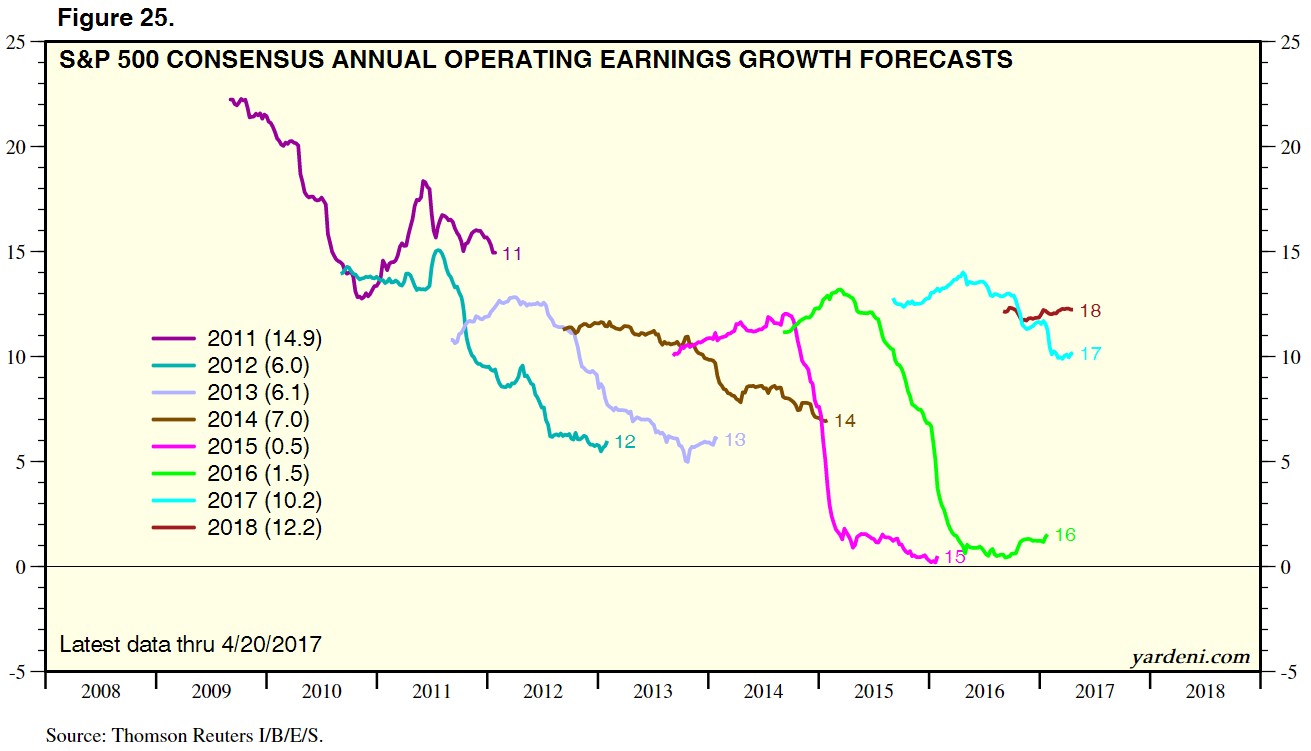
As was shown in the chart above, analysts have tended to be more optimistic than they should have been. The chart below looks at the changes in operating earnings forecasts in the past few years.
Either 2017 and 2018 will represent a reversal to the upside in expectations or we are in for a significant decline in earnings expectations, as has happened throughout the past 6 years.
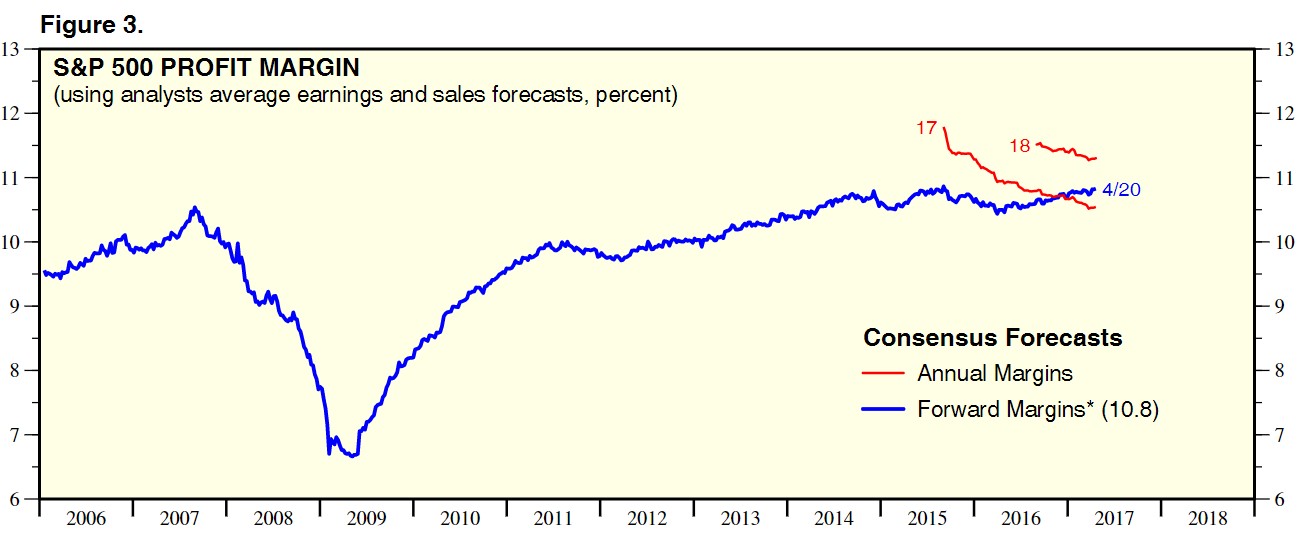
The chart below shows actual profit margins along with the estimates for future margins in 2017 and 2018. As you can see from the chart below, 2018 earnings margins are expected to reach a new record high. Usually margins revert to the mean. However, analysts only see green pastures.
Looking at operating earnings instead of as reported earnings is like viewing the world through rose colored glasses where taxes and interest don’t exist. Operating earnings for the past 12 months including Q1 results as of April 20th were $111.40 for the S&P 500. As was mentioned earlier, the 12-month as reported earnings are only $99.24. This translates to the S&P 500 having a 21.21 operating earnings multiple and a 23.81 as reported multiple.
The final point in this article is that stocks have been boosted by stock buybacks. Large firms borrowing money at low interest rates to retire their own shares has been one of the biggest drivers of this bull market.
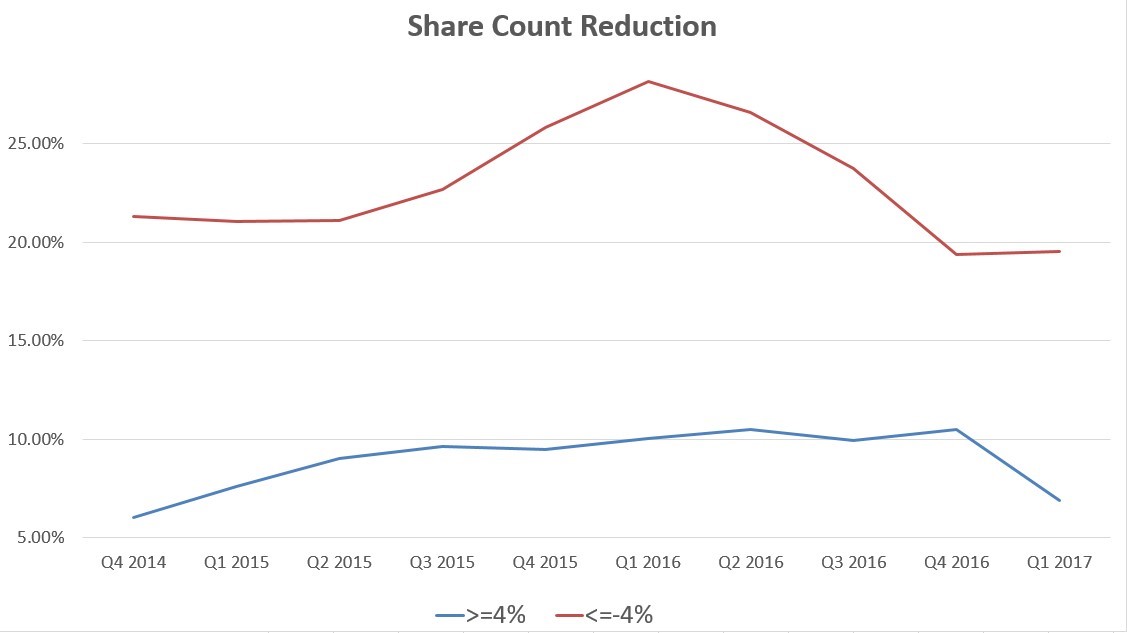
The chart below shows the latest stats on buy backs.
The two lines show the percentage of companies retiring their stock on a year over year basis. The red line shows the percentage of firms retiring less than or equal to 4% of their shares and the blue line shows the firms retiring more than 4% of their shares. Both lines have fallen because of the earnings recession. In Q1 there was a large decline in firms retiring over 4% of their shares. It went from 10.48% of firms in Q4 2016 to 6.90% in Q1 2017. This is worrisome, if the expectation is that the bull market is to continue.
Conclusion
The stone-cold reality is that although earnings have improved recently, they are still below the Q3 2014 record high. Stocks have ignored this as they are already up over 20% higher than they were in Q3 2014. Investors have ignored reality by rationalizing bad news and relying on analyst expectations as well as financial metrics that do not fully report the health of the business.
Have comments? Join the conversation on Twitter.
Disclaimer: The content on this site is for general informational and entertainment purposes only and should not be construed as financial advice. You agree that any decision you make will be based upon an independent investigation by a certified professional. Please read full disclaimer and privacy policy before reading any of our content.


