UPFINA's Mission: The pursuit of truth in finance and economics to form an unbiased view of current events in order to understand human action, its causes and effects. Read about us and our mission here.
Reading Time: 5 minutes
On July 26th, the VIX hit a record low which was 8.84. The VIX is the 30-day volatility index which is based on the S&P 500’s option prices. The low VIX implies investors expect the least amount of downside in the next 30 days of trading ever. That situation has been created by record trailing twelve month bottom up operating earnings in Q2, a dovish Fed, and global central bank asset buying such as the 60 billion euros per month in bond buying by the European Central Bank.
An interesting new development is occurring where traders are speculating that the VIX will go lower. Going short the VIX at the record low is akin to buying negative yielding government bonds. The only reason you take the risk is because the central bankers are on your side. These are high risk, low reward trades, but if the central bank guarantees the result, then it makes sense to take the trade. The obvious question is if the central bank if truly guaranteeing the trades. Speculators believe they can front run the central banks’ guidance. If you trust the word of the central bankers and their omnipotence, profits are easy to come by.
Some bears are worried that the trading in the VIX has gotten to such extreme levels that an unwind of the trade where money is lost on an increase in volatility (decline in stocks) could cause a domino effect where it impacts the trading in other asset classes. It’s like the tail wagging the dog. The dog is the stock market and the tail is the VIX. Trading in VIX futures was introduced in 2004 and VIX options were introduced in 2006. This means that these products haven’t been stress tested in a volatile environment. As you can see from the chart below, there wasn’t much noncommercial VIX activity during the 2008 financial crisis because the product was new. The next recession will be the first experiment with so much trading in the VIX.
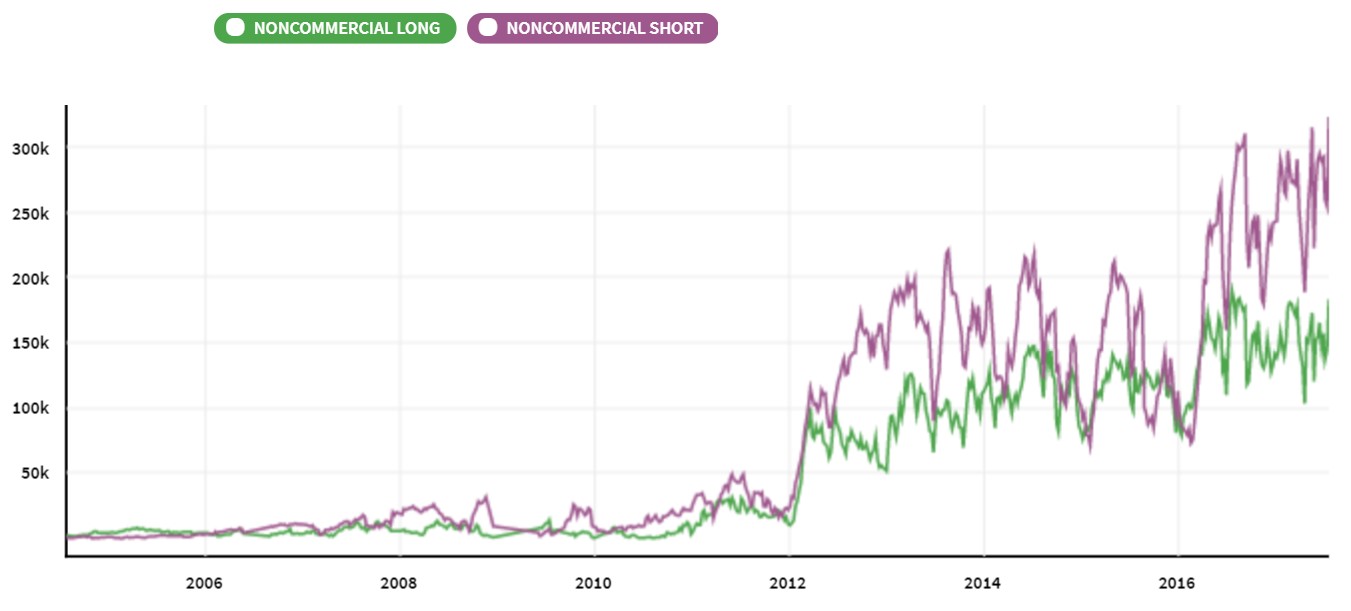
Non-commercial Positioning In The VIX
As you also notice from the chart, the short positioning is much higher than the long trading because investors are so confident the stock market will go higher. It’s likely that if we were to historically extrapolate the price of the VIX with the short positioning, this would be a record short positioning. As was mentioned, the key issue is whether the unwind of this trade affects the market. Warren Buffett once called derivatives “financial weapons of mass destruction.” The VIX futures market would be one example of how derivatives could cause destruction.
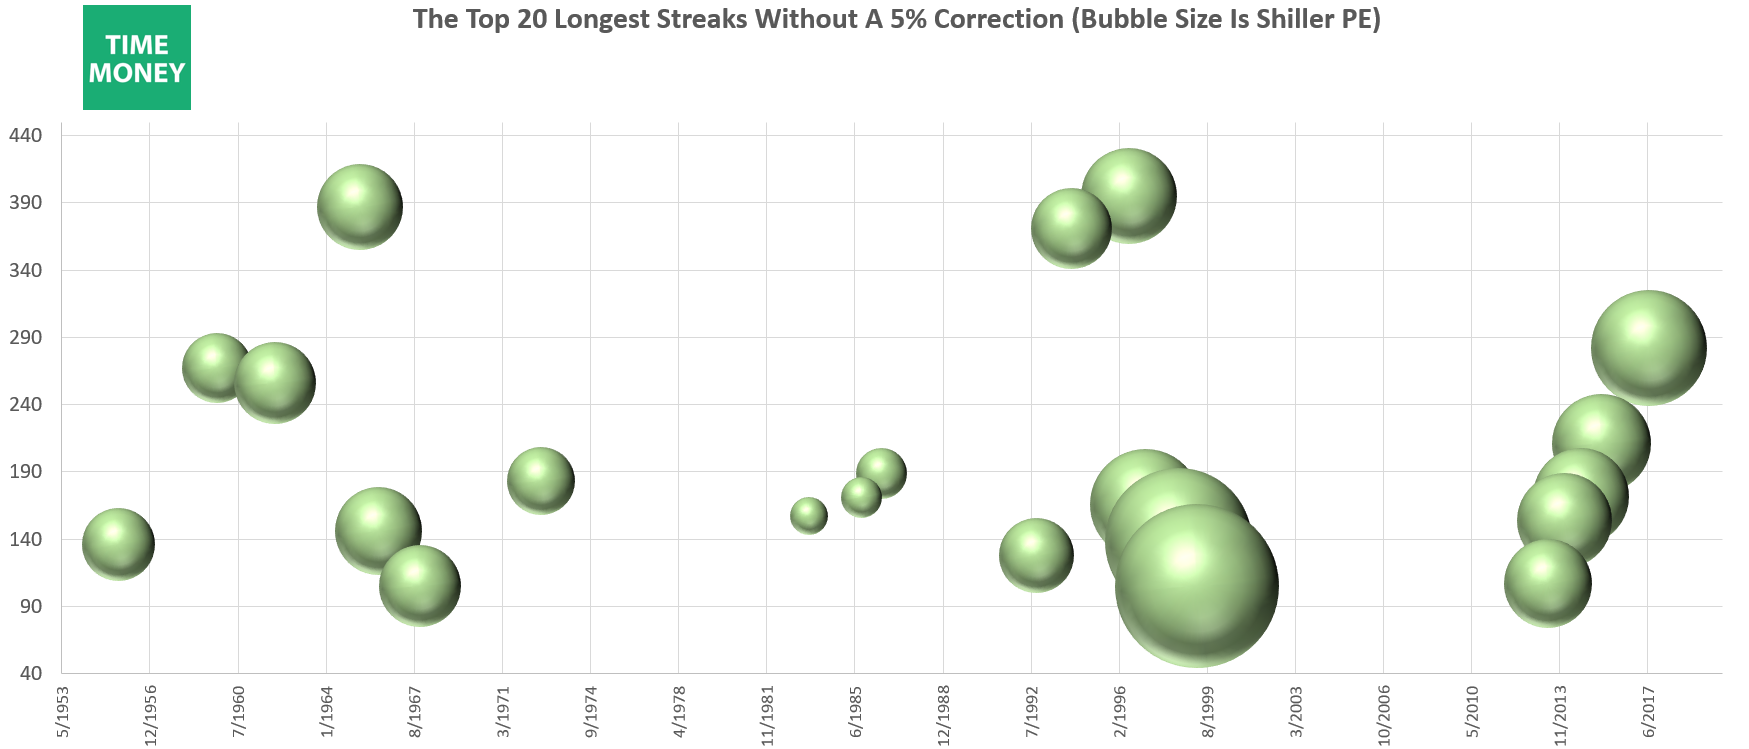
Looking at another way the market has gotten in an unusual situation, the S&P 500 is in its 4th longest streak without a 5% selloff. The streak is at 282 days as of August 8th. The chart below shows the top 20 streaks without a 5% correction. The higher the sphere is, the longer the streak. The size of the spheres is determined by the Shiller PE. The Shiller PE as of August 2017 is 30.35, making it the third largest sphere. The visualization of the spheres lets you see the size of the various bull markets.
The 1990s bull market and the current bull market stand out as the most expensive and have the most streaks. It’s interesting to see how in the beginning of the 1990s bull market, the streaks were longer. As the bubble grew, the streaks got shorter as the market couldn’t keep up the momentum because it was so expensive. This current rally is the reverse. The longer the bull market has gone on, the longer the streaks have gotten. Momentum and low-volatility are leading to higher stock prices as the rally feeds off itself. The 1990s tech rally was driven by excessive optimism in technology related firms. This latest rally is based off a new perspective on investing where investors buy ETFs passively, believing that the overall market will always move higher.
Looking at the demographics, the current age of baby boomers is 63-71. They are getting ready for retirement and want to save as much as possible so they are putting their money in stocks. They don’t have the inclination to trade in and out of the market, so they passively buy ETFs. 20 years ago, these same baby boom investors bought into technology stocks because they were more youthful and willing to take risk. If you accelerate this trend forward another 10 years, these investors will be shifting to bonds as they need their wealth to stabilize. It would cause a massive crisis if the stock market fell in the next few years because of the huge number of baby boomers retiring each year.
The Valuation Of The Longest Streaks Without A Correction
The chart below shows how the stock market isn’t the only place where speculation has gotten extreme. The corporate bond spreads, which are the difference between corporate bond yields and treasury yields, are nearing their pre-crisis lows. These spreads are supported by record corporate profits, the ECB bond buying, and the overall risk on mentality of the market. Low spreads in a low yield environment make now the easiest time to stay in business if you are a firm with a relatively weak balance sheet. When spreads move higher, all the firms which have been relying on cheap debt will have a tough time refinancing; some will go bankrupt. The trend of firms borrowing money to buy back stock will be reversed which will cause equity prices to tumble.
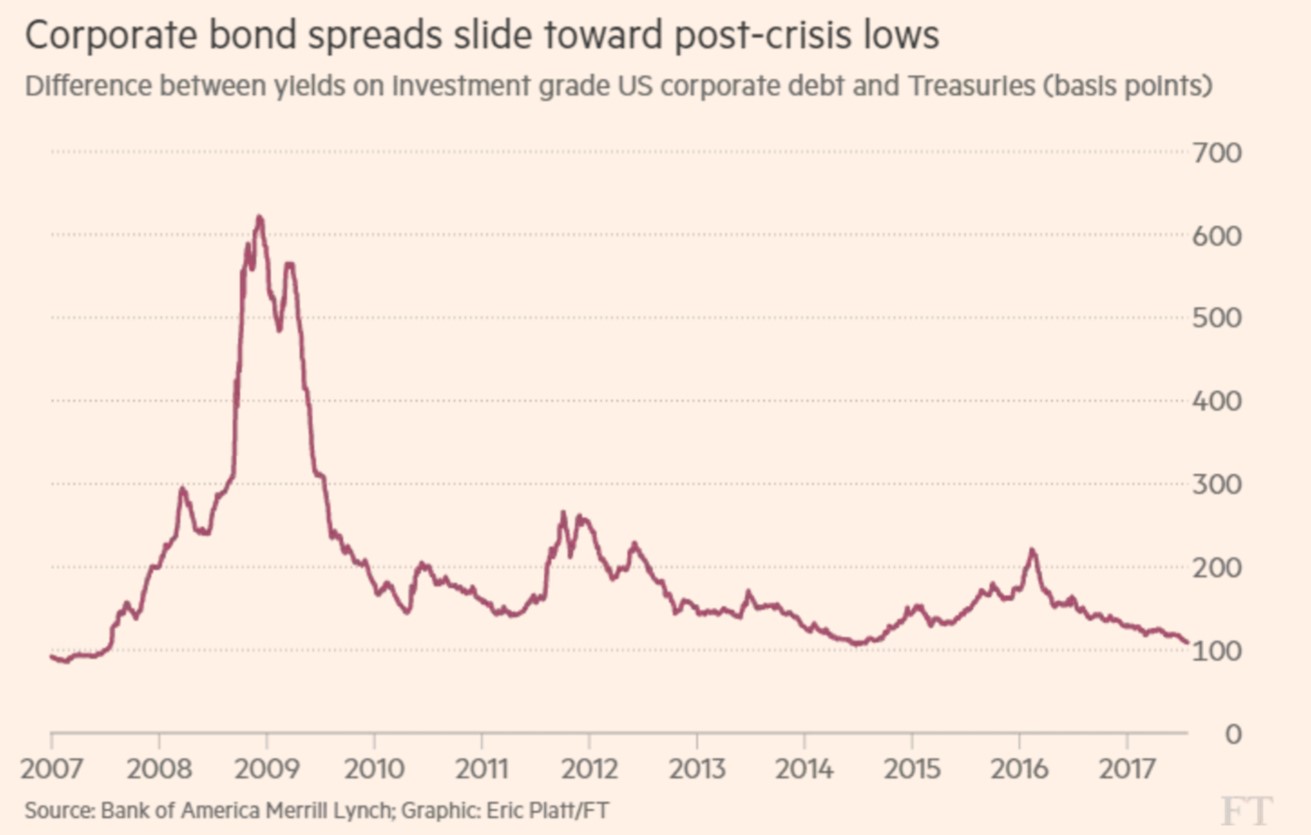
Corporate Bond Spread
Conclusion
The stock market is in an unusual period where it only moves higher and there’s almost never any selloffs. The moniker of this rally had been ‘buy the dip’ but lately there hasn’t been a dip to buy, so investors are buying the rip. This has led to the VIX reaching a record low, the streak without a 5% selloff reaching the 4th longest, and the Shiller PE reaching above 30. The most obvious catalyst to this environment ending is the global central bank tapering. An increase in volatility would spike the VIX leading to an unwind of the short VIX speculative bet which has been working well for a few years. Because there is such low liquidity, and everyone is positioned in one direction, any catalyst for a sizable correction could increase out of proportion. Make sure you are constantly monitoring your assets, and balancing your portfolio. Now may be a great time to rotate atleast partially out of equities. No rally lasts forever, and no it’s not different this time.
Have comments? Join the conversation on Twitter.
Disclaimer: The content on this site is for general informational and entertainment purposes only and should not be construed as financial advice. You agree that any decision you make will be based upon an independent investigation by a certified professional. Please read full disclaimer and privacy policy before reading any of our content.


