UPFINA's Mission: The pursuit of truth in finance and economics to form an unbiased view of current events in order to understand human action, its causes and effects. Read about us and our mission here.
Reading Time: 6 minutes
In this article, we’ll assess the state of the stock market, explaining what has been happening in the past few months and why the market has been moving in that direction. When you know what is the catalyst behind equity markets moving higher, it gives you an inside track into what will affect the future movements in the market. Our articles point you in the right direction to do research so you have a better shot at outperforming the market. As a reminder, if you are relying on passive investing, that may not be the right strategy as we have detailed here in our financial literacy article.
The Bull Is Alive
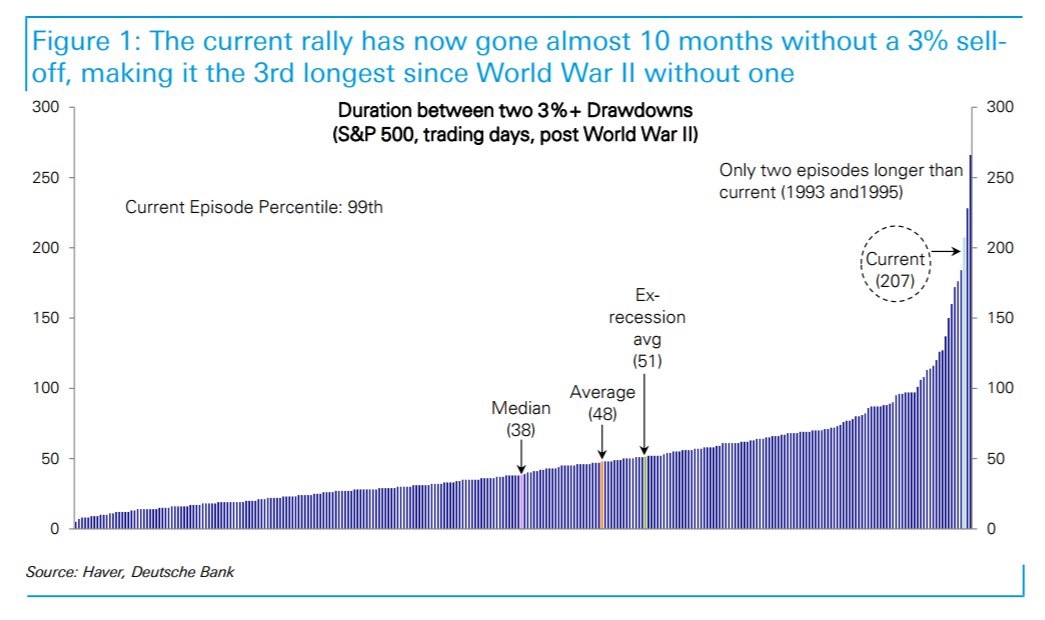
The Deutsche Bank chart below does a great job of explaining the latest movement in equities.
This latest trend of the market avoiding a 3% selloff for 10 months is in the 99th percentile, in terms of length, historically. There have only been two instances where the market has gone longer without a 3% selloff. A 3% decline doesn’t even count as a correction which is usually considered to be in the 5%-10% range. To be clear, the market is also running a near record long streak without a 5% correction. The lack of a 3% selloff has ruined the best trading advice of this bull market ‘buy the dip.’ You would have thought buy the dip would have ended with a prolonged bear market, but instead it has occurred because normal dips have become temporarily obsolete. The new term is ‘micro-dip’ which is a downturn of 2% or less which was considered a relatively normal event outside of this period and the mid-1990s.
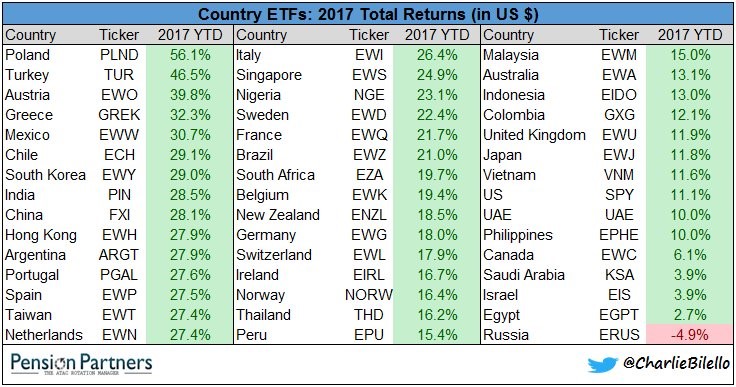
The U.S. stock market isn’t the only place that’s rallying. As you can see from the Pension Partners’ table, the entire world is seeing positive action (besides Russia which is dealing with U.S. sanctions and weak oil prices) in U.S dollar terms.
This has been brought about by an improvement in global trade and most central banks cutting their interest rates along with the G3 central banks (America, Japan, & Europe) expanding their balance sheets. We’re in what is traditionally known as a Goldilocks economy where growth isn’t leading to inflation, according to the CPI atleast. This allows decent economic growth to be combined with monetary stimulus. The one question which lingers is if the G3 central banks would stop QE even if there was inflation given their latest addiction to it.
Credit Markets Show Strength As The Economy Keeps Expanding
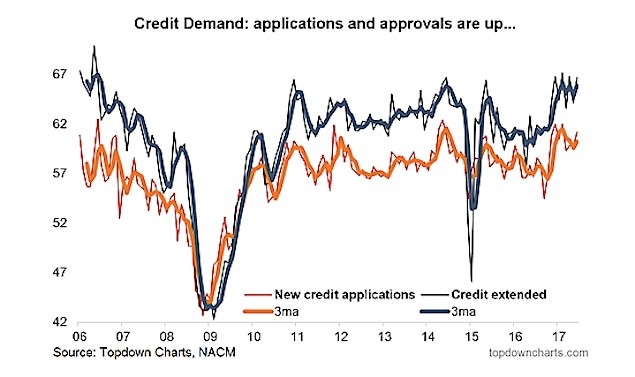
The U.S. economy runs on credit, so it’s important to check in on that to see if the cycle is slipping. As you can see from the Topdown chart below, both credit applications and credit extended are up.
We’re in the rare circumstance where credit conditions are improving in a rising rate environment. The two reasons for that are global central bank asset purchases and oil stabilizing this year. In the beginning of 2016, the recovery rate on junk bonds was at a record low. The recovery rate is the rate of capital return after a bankruptcy. Remember, the bondholders get what remains of the company when it fails; the equity holders usually lose everything.
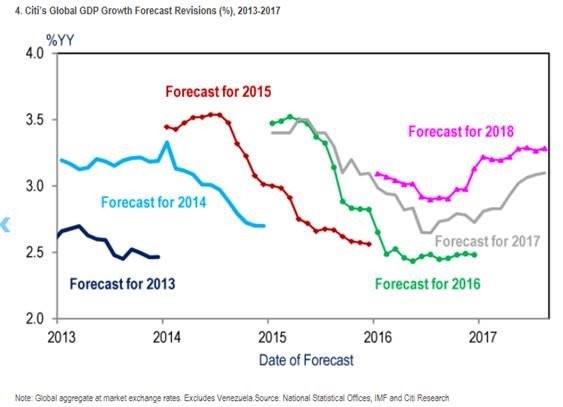
This year has been unusually good for the economy compared to the past few years. As you can see from the Citi chart, we’re in a trend breaking year where the forecasts have moved higher instead of lower.
The Q2 GDP first revision was unveiled at the end of August. It showed annualized quarter over quarter growth was 3.0% instead of the originally reported 2.6%. This report and some of the other economic reports in Q3 are the reason why the 2017 forecasts have moved higher. As you can see, the forecasts were revised lower in 2013, 2014, 2015, and 2016. The latest great economic reports have also moved up expectations for 2018. This could be a negative for 2018 because bull markets are founded on pessimism and bear markets are founded on optimism. That being said, stocks have rallied even during the prior disappointing years.
Q1 & Q2 Earnings Were Great, But Q3 Is Fading
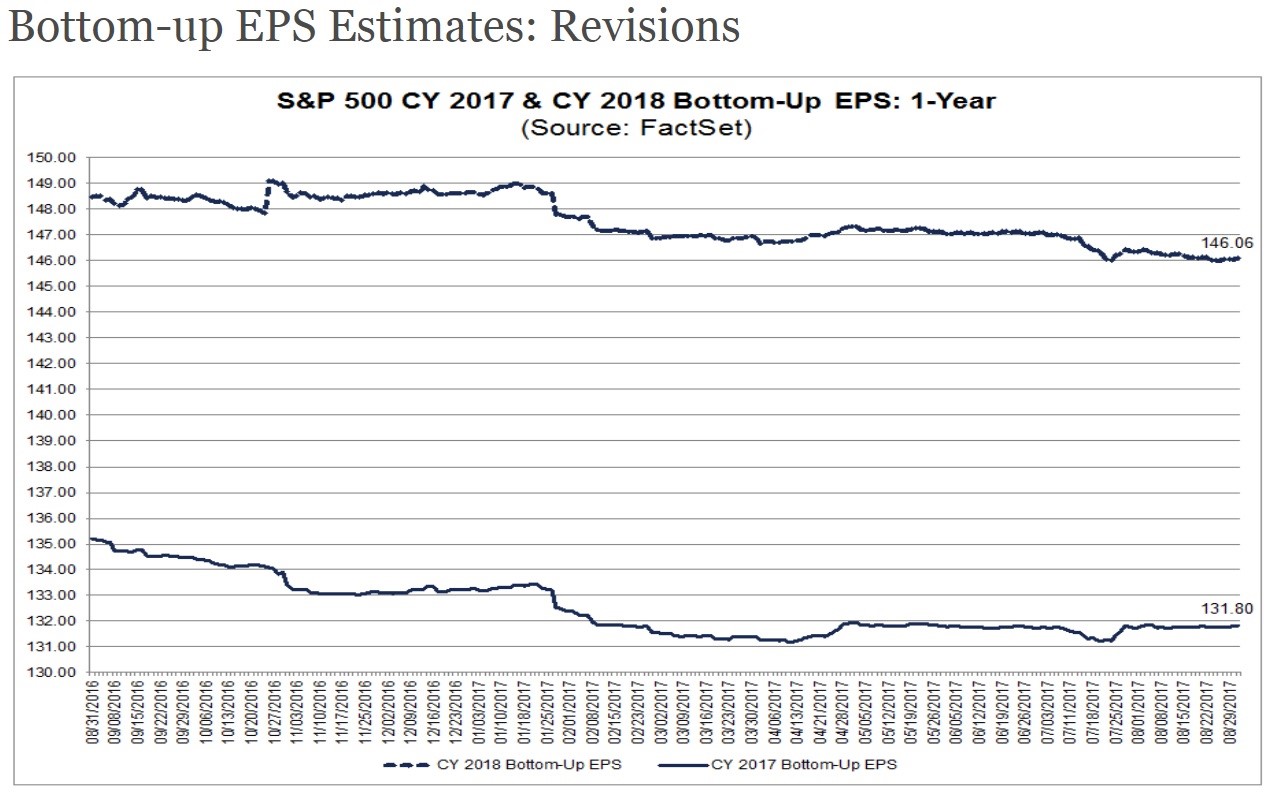
The S&P 500 bottom up earnings revisions have also been moving higher as you can see from the FactSet data.
The 2017 bottom-up estimates fell throughout 2016 and early 2017 because 2016 earnings were so terrible. During the 2017 Q1 and Q2 earnings seasons, the full-year bottom-up earnings estimates were revised higher for a change. 2018 doesn’t look as good, but the full-year estimate is only down about $1 from early 2017. That’s inconsequential as the 2017 estimate has fallen about $3 in the past 12 months and it has been a good year so far.
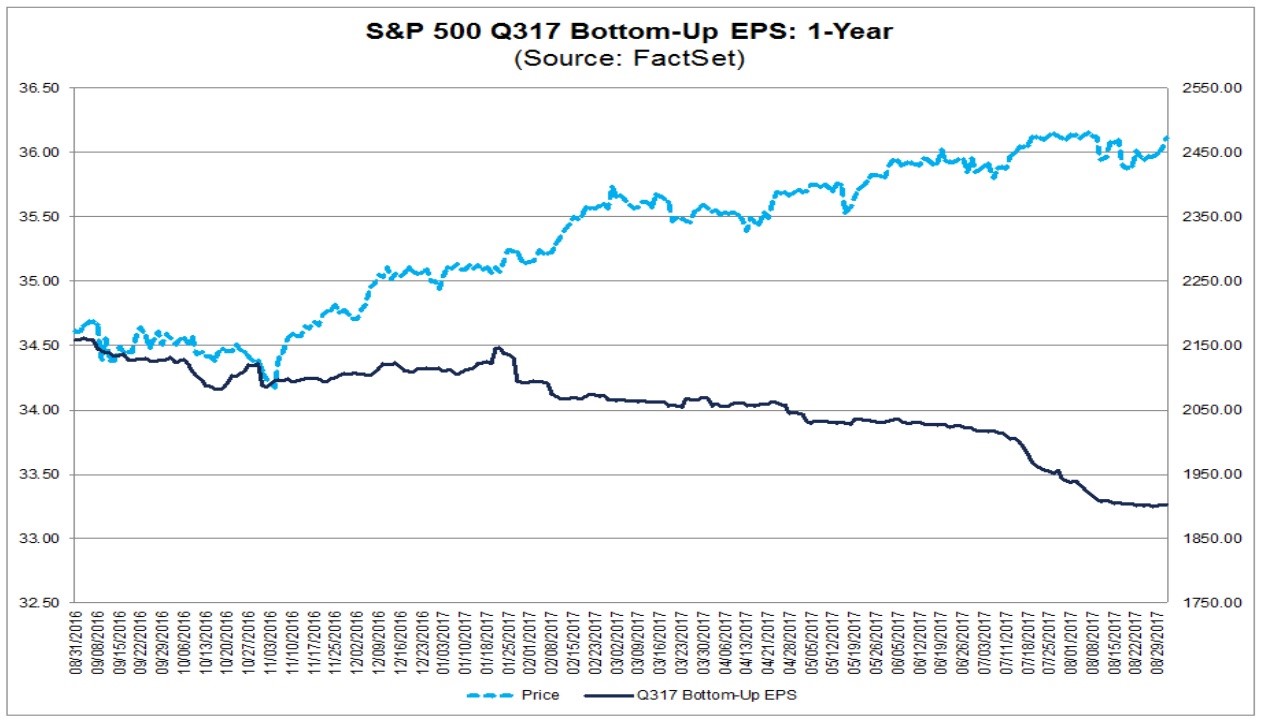
The results for Q3 don’t look as good as Q1 and Q2. The estimates have been falling sharply despite the falling dollar which should act as tailwind for multinationals’ profit growth. The estimate declines have been priced in the market as it’s widely known they are crashing. The question which will be answered in 1.5 months is if the lowered bar means results will be surpassed easily or if the run of great earnings is over. For the first time since Q3 2016, the dollar index will be down year over year which is great for nominal earnings considering the big headwind the dollar caused earnings in the past two quarters. The index started the year at $102.22 and is now at a $92 handle.
The BOJ Buys Everything
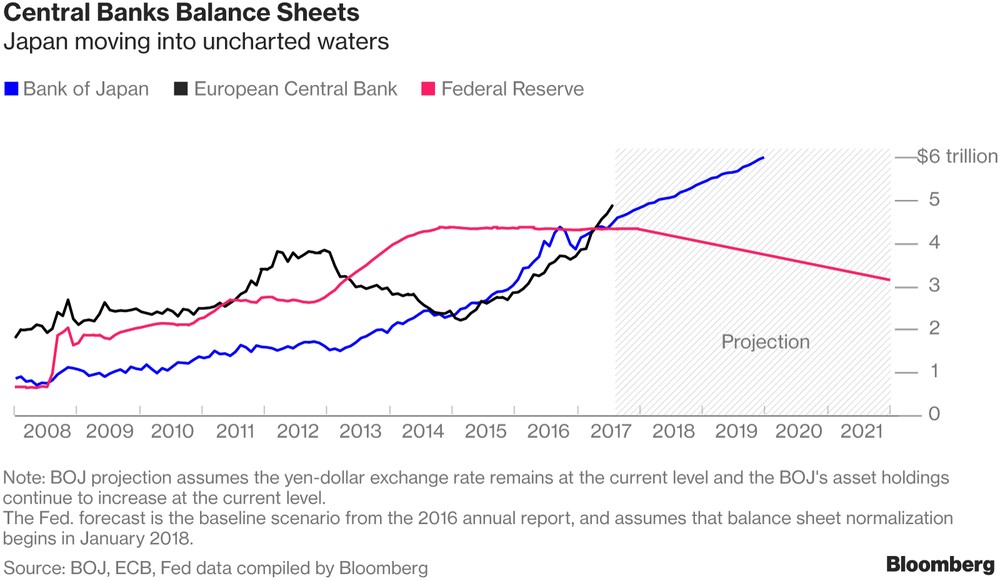
As was mentioned, central bank policies have an impact on the equities market. As you can see from the Bloomberg chart, the Fed is expected to unwind its balance sheet and the BOJ (Bank of Japan) is expected to expand it. The ECB is left unknown in this chart. The monetary policy is unknown as the plan for 60 billion euros in bond buying per month will be expiring in December. Mario Draghi will announce future plans in October. It’s likely that some type of tapering will occur because European economic growth has accelerated even though inflation is relatively tepid.
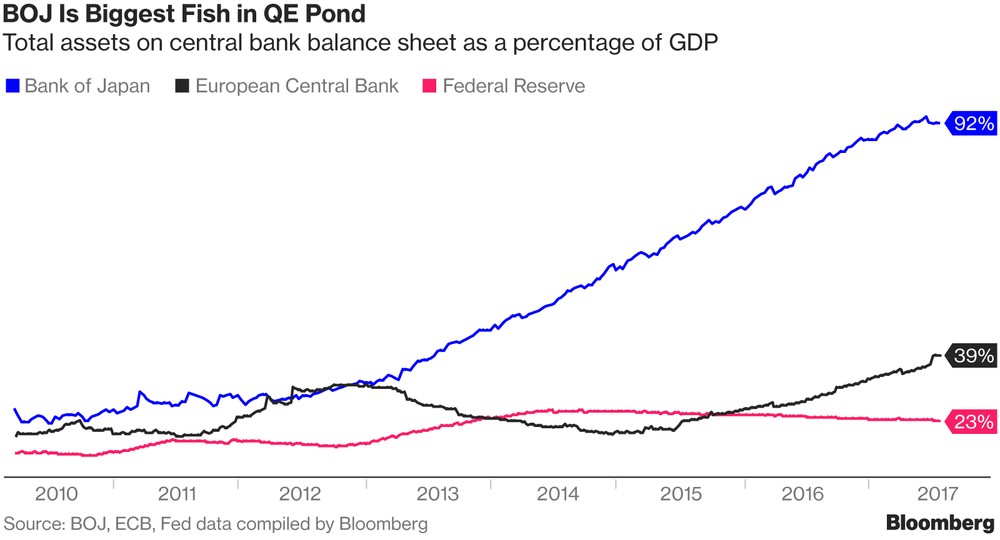
The three major central banks all have similar sized balance sheets, but the BOJ’s balance sheet almost encompasses the entire economy. The BOJ may be at a point of no return; regardless of the economic growth or inflation the BOJ might continue with this buying policy. When a central bank buys up an asset to the point where it ruins price discovery completely, the asset will be destabilized if the central bank ever sells it. Bond speculators buy low yielding government bonds because they expect the BOJ to continue buying. It’s been a great bet in the past few years.
Conclusion
Most economic growth statistics are solid and S&P 500 earnings are at a record high. This combined with central banks pumping stimulus into the financial system has provided a scenario where almost every equity market around the world is up in 2017 and the S&P 500 almost never corrects. Some of the catalysts which can stop this are rising rates, a rising dollar, and disappointing earnings. One of the most important events which will tell us how the market will do in 2018 is when Draghi announces the next step for the ECB’s QE program in the autumn.
Have comments? Join the conversation on Twitter.
Disclaimer: The content on this site is for general informational and entertainment purposes only and should not be construed as financial advice. You agree that any decision you make will be based upon an independent investigation by a certified professional. Please read full disclaimer and privacy policy before reading any of our content.

