UPFINA's Mission: The pursuit of truth in finance and economics to form an unbiased view of current events in order to understand human action, its causes and effects. Read about us and our mission here.
Reading Time: 6 minutes
The 2nd half of 2017 and 2018 will be pivotal moments for monetary policy. Global central banks have bought assets to the tune of trillions of dollars in the past few years, known as quantitative easing. Central bankers are providing guidance for future policy which entails shrinking their balance sheets (U.S. Federal Reserve) and tapering their expansionary policies (Bank of Japan & European Central Bank). The biggest question which remains is what that will do to financial asset prices which have increased remarkably. In fact, the ratio between financial assets and real assets is at a record high.
The chart below compares the MSCI World Index, which shows global stock prices, with the major global central banks’ balance sheets, which include the ECB, Fed, and JCB.
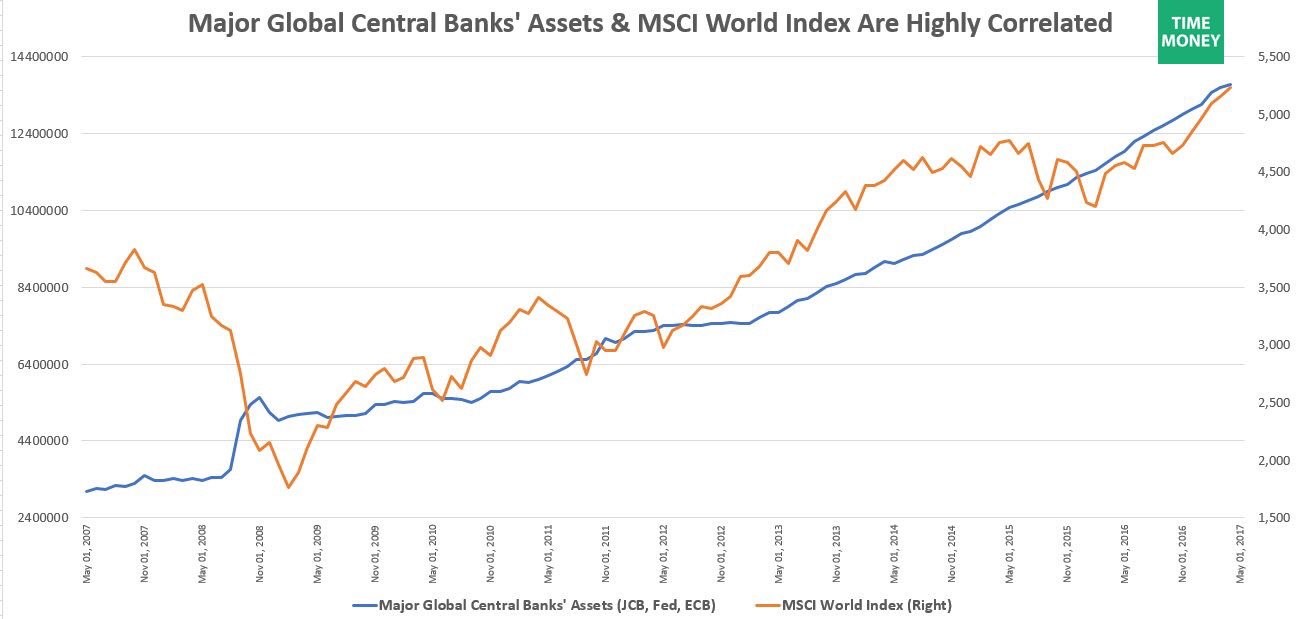
Central Bank Balance Sheet Expansion Pushing Global Stocks Higher?
Using the data from 2007, the two metrics have a 79% correlation. Lowering interest rates encourages risk taking behavior as investors search for yield. This is the main thrust behind equities moving higher. Not only bonds are being bought. The JCB has bought stock ETFs and the Swiss Central Bank has been buying stocks, with Apple being one of its top holdings. While skeptics of the effect central banks are having on the market can dodge the effects bond buying is having on stocks, there’s no question buying equities boosts valuations to artificially lofty levels.
The European Central Bank has been more aggressive than the Fed as it is buying corporate bonds instead of just treasuries and mortgage bonds. As you can see from the chart on the left, ECB QE has led to an influx of negative yielding bonds.
In the chart on the right, it shows that ECB corporate bond purchases have caused high yield bonds to offer lower yields than stocks. This manipulates the market place as it causes excess risk taking as the cost of capital is non-existent, creating artificially extended booms and busts in the business cycle – one doesn’t happen without the other. Think of how fiscally irresponsible you would be if you won the lottery. Low cost of capital encourages this poor behavior. The ECB now owns 13.4% of the 649 billion euro corporate bonds outstanding. That’s heavy manipulation.
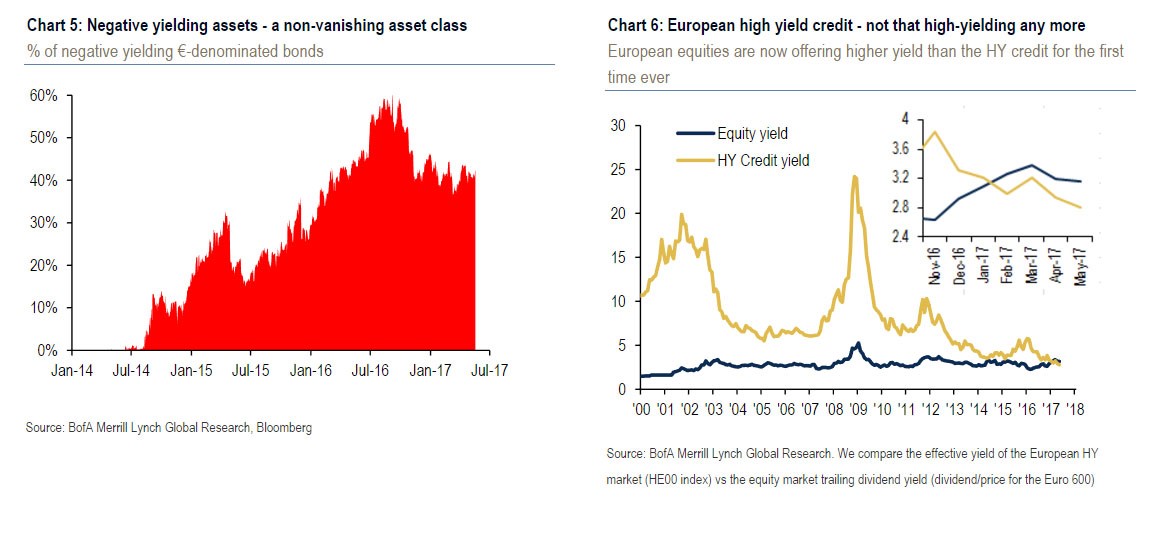
ECB Asset Purchases Causing Negative Yields
The chart on the right furthers this point as the increases in the central banks’ purchases have probably led to credit spreads tightening. Credit spreads are the difference between treasuries and more risky bonds. For example, a strong economy would have a small difference between risky junk bonds and less risky treasury bonds, which are incorrectly perceived as safe haven risk free assets, because this good business environment and excess liquidity ensures pent up demand for financial assets means even the worst firms can do well and pay their bills. That would be an example of a tight (low) spread. When the economy goes sour, junk bonds start to default as investor expectations of risk increase, making their yields increase relative to the safer treasury bonds. That would be an example of a wide spread which has stressed financial conditions.
As you can see in the chart on the left, the size of the central bank asset purchases is expected to diminish in 2017. Eventually, the size of the balance sheets is expected to start decreasing in 2018. As you can see from the chart on the right, the credit spreads look like they will widen if the relationship is consistent with how it started in 2008 when these purchases began.

Central Banks Unwinding Their Balance Sheets Could Widen Spreads
As you can see from the chart above, the Fed will be unwinding its balance sheet while the ECB and BOJ will be tapering their purchases. The ECB is scheduled to buy $60 billion in bonds per month until December. Afterwards, we don’t know what the ECB will do. In its June meeting, the ECB stated it hadn’t discussed tapering. That was either a response to the tepid inflation or because it’s too early to discuss policy 7 months in advance.
The charts below show Goldman Sachs’ estimates for when the Fed will unwind its balance sheet.
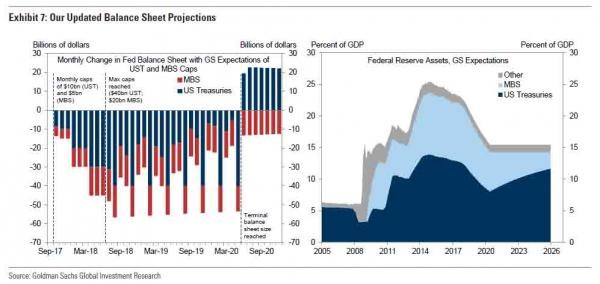
Fed Balance Sheet Projections By Goldman Sachs
The Fed has since announced it will start with allowing $6 billion per month in treasuries to expire and $4 billion per month in mortgage backed securities to expire. These caps will last for 3 months. Over 12 months, the Fed will raise the caps to $20 billion per month in mortgage bonds and $30 billion per month in treasuries. Ben Bernanke, former Fed chairman, has suggested maintaining a $2.5 trillion balance sheet after the unwind is over. Goldman Sachs’ has the unwind ending in mid-2020.
It’s easy to be skeptical of this policy because the chance of the economy avoiding a recession until 2020, especially with the Fed raising rates, is unlikely. As you can see from the chart below, the Fed is acting like the overly optimistic CBO.
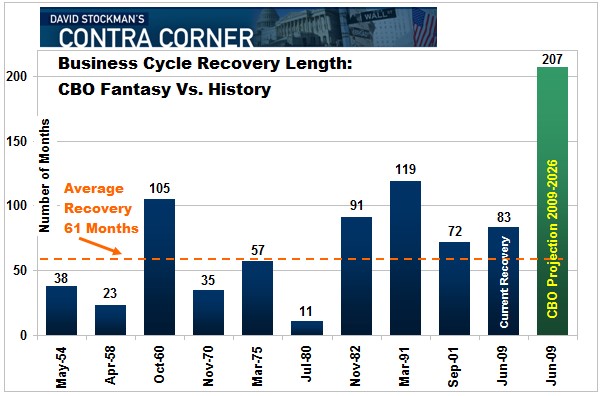
CBO Expects Recovery To Last Forever
The CBO’s budget expects the economy to avoid a recession until at least 2026. That would be almost twice the record length of a recession-free period. By the middle of 2020, the recovery will be 107 months old which would be the 2nd longest recovery since at least 1964.
The Fed’s unwind policy is unprecedented, so it’s tough to predict what will happen. The chart below shows the most recent unwind as the ECB shrunk its balance sheet from about $3 trillion to $2 trillion. This is different from what the Fed will do because the slack was taken up in 2013 by other central banks, but in 2018, the slack won’t be taken up.
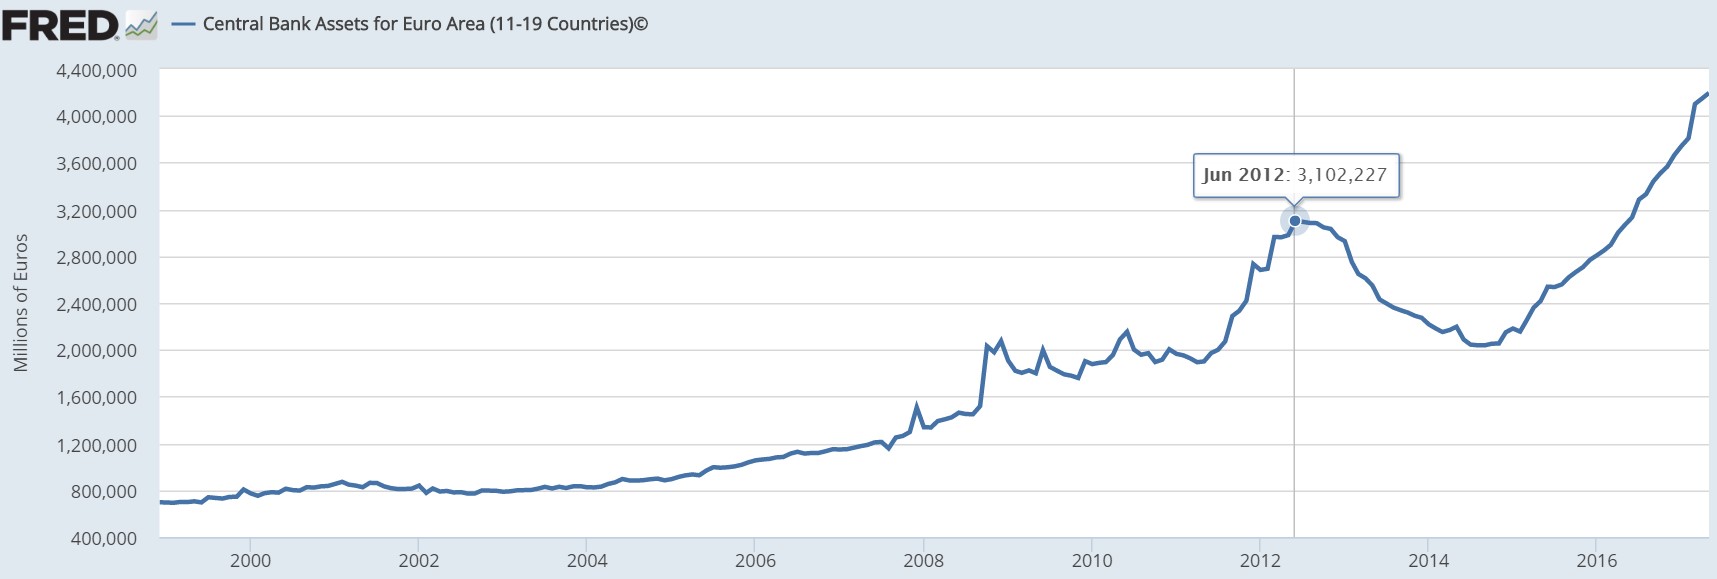
Brief ECB Balance Sheet Unwind
Comparing the Fed’s 2017-2020 unwind to the ECB’s June 2012 to August 2014 unwind is not a great way of predicting what will happen because the ECB bought different assets. It’s also worth noting that the ECB quickly gave up on stabilizing its balance sheet and bought more bonds than ever. The ECB’s balance sheet is currently the largest in the world.
The EuroNext 100 index, which is a measure of European stocks, was at 563.11 in June 2012 and at 836.93 in August 2014. That’s an amazing 48.6% increase. It may have been driven by various economic factors or the other central banks picking up the slack. In June 2012, the euro/dollar was at $1.29 and was at 1.32 in August 2014. This means the euro strengthened versus the dollar. It makes sense a hawkish policy would do that. In June 2012, the European inflation rate was 2.36% and in August 2014 the inflation rate fell to 0.36%. Since then the inflation rate has risen to 1.4% as of May 2017. In Q2 2012, the European Union’s GDP growth rate was -0.41% and in Q3 2014 it was 1.67%.
Conclusion
The increase in central banks’ balance sheets has caused unknown distortions in the marketplace. We will see how the economy and risk assets can stand on their own two feet in 2018 when the collective balance sheets start to shrink as the Federal Reserve suggests it may start doing so. Many skeptics believe this won’t happen because the market is addicted to central banks purchasing assets. Violent moves in assets could be coming in the next 12 months.
Have comments? Join the conversation on Twitter.
Disclaimer: The content on this site is for general informational and entertainment purposes only and should not be construed as financial advice. You agree that any decision you make will be based upon an independent investigation by a certified professional. Please read full disclaimer and privacy policy before reading any of our content.


