UPFINA's Mission: The pursuit of truth in finance and economics to form an unbiased view of current events in order to understand human action, its causes and effects. Read about us and our mission here.
Reading Time: 5 minutes
There are always contentious debates among bulls and bears on various topics. As a fair-minded investor, you don’t want to put yourself on any ‘side’ of a debate because investing isn’t a team sport. The only person you hurt when you side with a group based on pre-conceived notions is yourself. Both sides in any debate will usually have decent arguments which helps you feel good by rationalizing your own investing behaviors if you always remain on one side. However, investing, whether you are deciding on which education to get or what stock to buy isn’t about feeling good, but about being right.
One of the top arguments that the bulls and the bears have is whether the housing market is in an echo bubble, something we extensively discussed in Is US Housing In A Bubble, Again? An echo bubble is a second bubble after the first burst like how an echo reflects sound. The most important aspect to any bubble is debt. Credit artificially increases demand, pushing up prices to heights they normally wouldn’t reach. Leverage is also what causes the bubble burst to have widespread damage as liquidity issues emerge when the credit market freezes. Therefore the same catalysts the help a bubble form, are those that help it subside quickly yet painfully.
The current scenario is best expressed by the Daily Shot’s chart. As you can see, the non-mortgage home equity debt has declined since the financial crisis. Borrowers aren’t tapping into their house’s value as much to make repairs. It can be a risky situation when a borrower uses the home’s one equity line of credit too much and the price of the house falls causing a loan to value ratio of above 100% putting the borrower underwater. If anything, borrowers are now being too cautious to avoid what happened during housing bust. This is the sign of a healthy market.

Home equity debt down, auto loan debt up
We’re now in a typical real estate market where some areas get overvalued, some areas stay fairly valued, while others are undervalued. Don’t get tricked by the bears when they show charts like the one below. It shows the Seattle housing market broken down by three pricing tiers.

Seattle housing heating up
The market is very heated, but it’s important to not make the illogical leap to the conclusion that the entire U.S. housing market is in a bubble. The reason why people make illogical judgement calls stems from intellectual laziness. It’s easy to claim everything is overvalued because no research is necessary. An analogous situation would be claiming the market is overheated because Tesla stock rises without it achieving profitability. The counterargument to this is Snap and Twitter stock have languished after failing to make money. Both arguments are wrong because they have nothing to do with the overall valuation of stocks and the state of the economy. You may say that most people only use these stocks as bellwethers for the market, but even that is a logical crutch.
In real estate, location is the most important determining factor of where the price will go. It’s easy to get distracted from the fundamentals because location didn’t prevent most areas from seeing large corrections in 2008. Don’t be fooled into thinking the fundamentals have changed because of one rare instance. Do you price tech stocks based on what they did in the 1990s?
Zillow comes up with a Home Value Index to show housing prices in various cities. The image below is from the Seattle area.
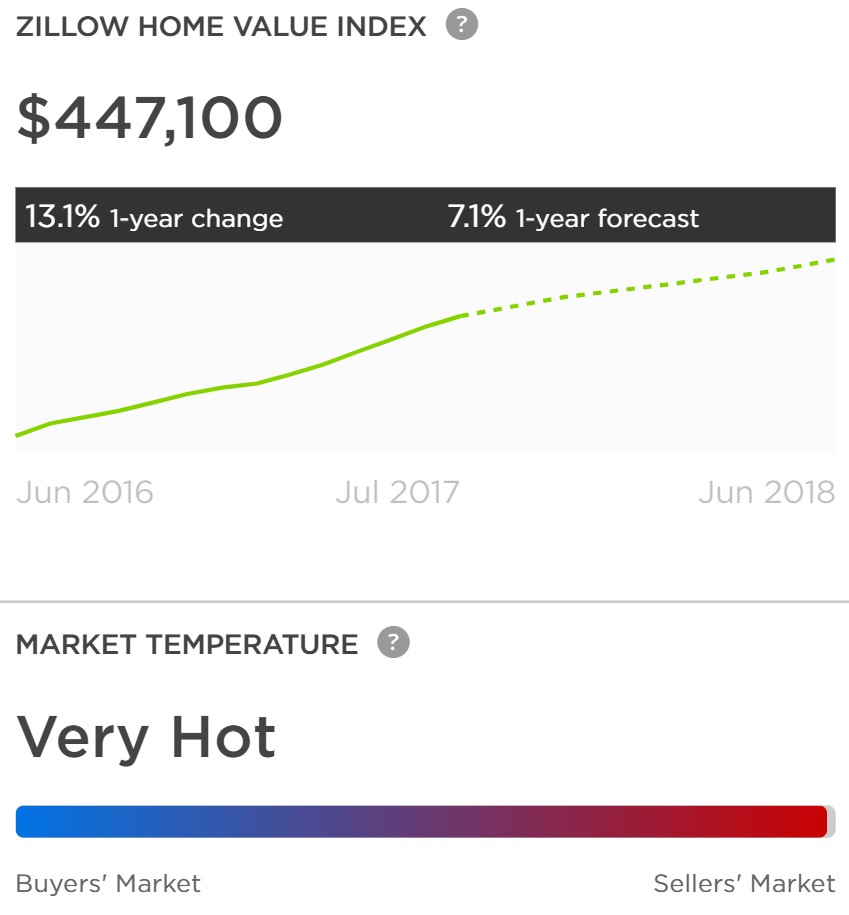
Seattle is very hot according to Zillow
Seattle has had the biggest price increases out of the top 20 cities in America in the past year. Prices were up 13.1% in the past 12 months making this market very hot. It’s unlikely to stay that way as high prices encourage construction which increases supply which lowers prices. There’s also the issue of affordability as prices can’t rise faster than wages forever. Zillow projects prices will rise another 7.1% in the next month making the 2-year growth stack 20.2%. That might be an overzealous prediction. The two most important factors affecting future Seattle home values are interest rates and the labor market. If rates rise, prices will fall or growth will slow; if joblessness increases prices will also fall or growth will slow. Let’s not forget, Amazon has had a substantial impact on the micro economy of Seattle, therefore being another catalyst of the increase in home values.
Auto Bubble?
The Daily Shot chart shows the area where there is debt fueled demand which could be a bubble. That area is autos were total debt has exceeded $1 trillion as we have detailed previously in How To Profit From Auto Subprime Bubble?. The vehicle market has had a mediocre year as the price for new cars fell 0.5% in July which was the 6th straight month of declines. The seasonally adjusted annual run rate of vehicles sold was 17.1 million in July which is down from 18.4 million at the peak in December 2016. This marginal weakness is closer to a plateau than the crash in 2008. In November 2015, sales peaked at 18.4 million and fell to 17.2 million in March 2016. We aren’t at the precipice of a serious crash. In fact, Hurricane Harvey may have prolonged the cycle of the auto sector, creating more demand with an estimated 500,000 vehicles being totaled according to CNBC.
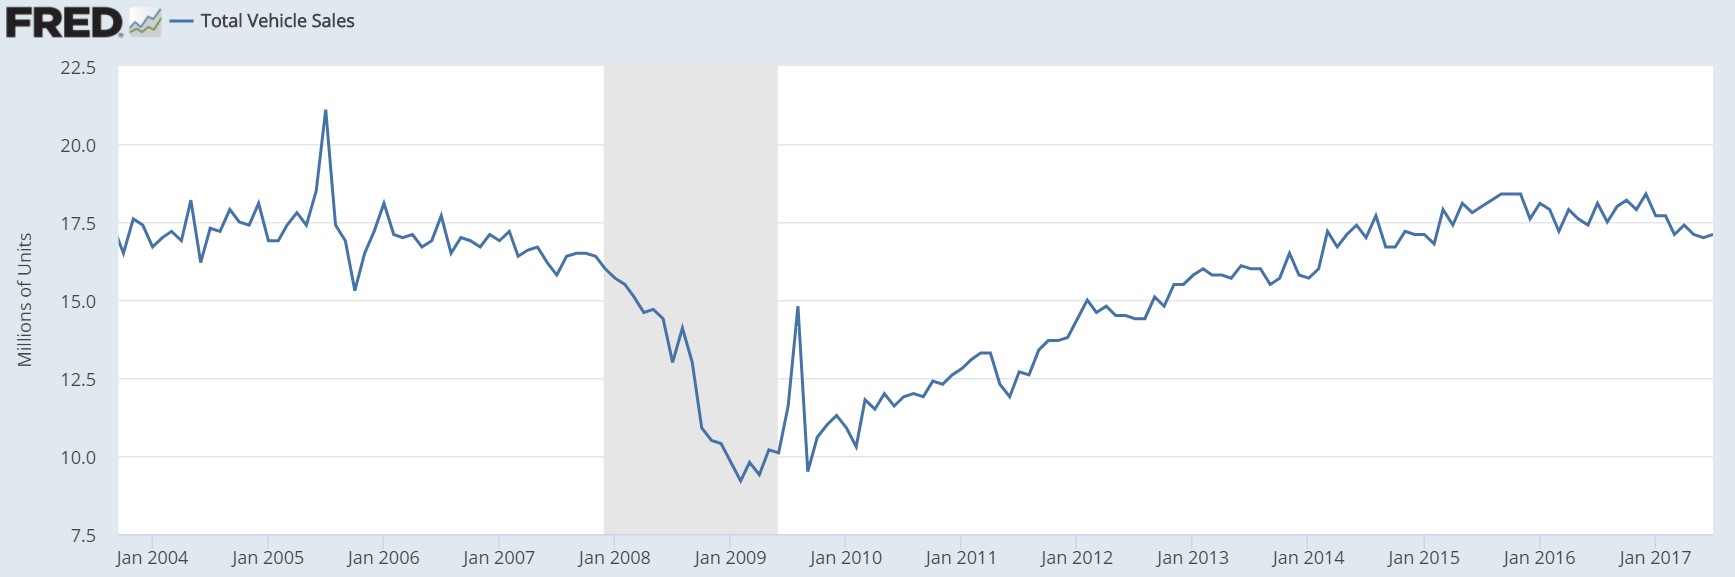
Seasonally adjusted annual rate of vehicle sales
Weakness in the auto market has effects on the economy since it’s still important to economic growth although less so than during the height of Detroit in the 1950s. The Macrobond chart breaks down the contributing factors to total U.S. durable manufacturing production.
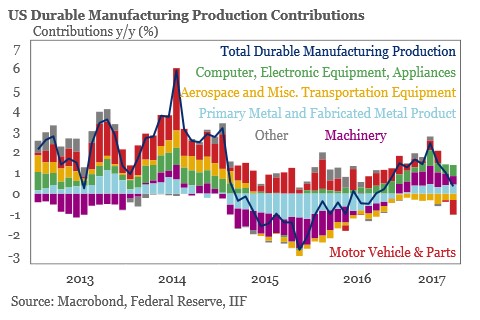
U.S. durable manufacturing production
The contribution motor vehicles and parts made to the economy was the lowest since 2009. That has brought growth to near zero. As you can see, the manufacturing economy went into a recession in 2015-2016. That didn’t push the overall economy into a recession, although it did come close in early 2016. This contextualizes the motor vehicle productions’ contribution to the economy. Weakness stemming from an end to the record sales period can’t put the economy in a recession. The market would have to completely roll over. That wouldn’t likely happen unless there was weakness in the labor market. This makes the argument that the auto bubble won’t cause a recession, but it will make the recession worse as the debt unwinds from the borrowers with low credit scores.
Conclusion
There are some overheated areas in real estate which will come tumbling down in the next recession, but there won’t be a repeat of 2008 as it relates to home prices tumbling quickly in most regions of the US. Seattle is one of those areas prone to being in a bubble, as Zillow ranks the city as ‘very hot.’ The auto market weakness isn’t intense because the economy is muddling along even with tepid growth. The auto sector is causing the durable goods manufacturing growth to weaken, but it’s not important enough/weak enough to catalyze a recession like the housing market did in 2008.
Have comments? Join the conversation on Twitter.
Disclaimer: The content on this site is for general informational and entertainment purposes only and should not be construed as financial advice. You agree that any decision you make will be based upon an independent investigation by a certified professional. Please read full disclaimer and privacy policy before reading any of our content.


