UPFINA's Mission: The pursuit of truth in finance and economics to form an unbiased view of current events in order to understand human action, its causes and effects. Read about us and our mission here.
Reading Time: 5 minutes
It’s not a far-fetched statement to conclude that the current environment is highly unusual. The most obvious place to look is stocks. Almost every stock market is up across the world. Volatility in American stocks has plummeted recently to record lows. The 10-day realized volatility of the VIX is 2.76. The chart below shows the rolling sum of corrections of various percentages since 1965. The orange line shows that the number of daily declines/increases of more than 1% has reached a 22-year low of 13. The 14-day S&P 500 closing range is 0.32% which is the lowest in the 90-year history of the S&P. In 1926 the S&P only had 90 stocks; it reached its current state of 500 companies in 1957. You know when you’re going back to the early 1900s, history is in the making.
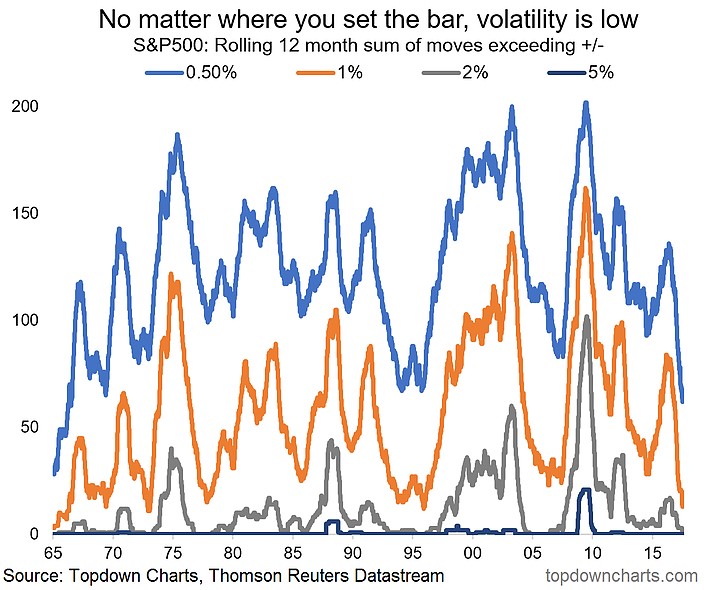
Rolling 12-Month Corrections
Another record, which isn’t even in the same ballpark as the other figures, is the consecutive months with positive non-farm payrolls (jobs growth). As you can see from the chart below, the current streak is 82 months. The job market is arguably the strongest ever by looking at this stat and the jobless claims to population ratio which is the lowest ever. However, as we have detailed before the labor force participation rate may be a far better estimate of true unemployment rate. The chart below shows the changes in the Fed Funds rate during each streak. Despite this current streak being the longest, it has had the smallest increase in the Fed Funds rate as it’s up only 1%. It was increased 1.87% in the 1980s streak, 4.25% in the 2000s streak, and 3.50% in the 1970s streak.
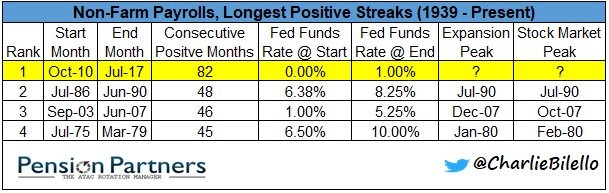
Longest Payrolls Growth Streaks
These two points give you a perspective of where the economy and market are. Stocks are rallying because the Fed has kept rates low plus there’s central bank liquidity being added to the market from the ECB and BOJ, pushing yields lower. Obviously, rates were cut to the lowest level ever, but what’s particularly unusual is the Fed isn’t acting hawkishly when there’s strong job growth based on the establishment survey which they pay close attention to.
We have discussed the information seen in the charts below in separate articles, but we’ve never looked at them together. The chart is a few months old so the Fed funds rate is actually 50 basis points higher than is shown, but that’s small potatoes. The chart shows the Fed Funds rate compared to the Taylor Rule which estimates where the rate should be based on various economic data inputs. Clearly the Fed Funds Rate has been below the Taylor Rule for the longest period ever, spurring increases in stock multiples.
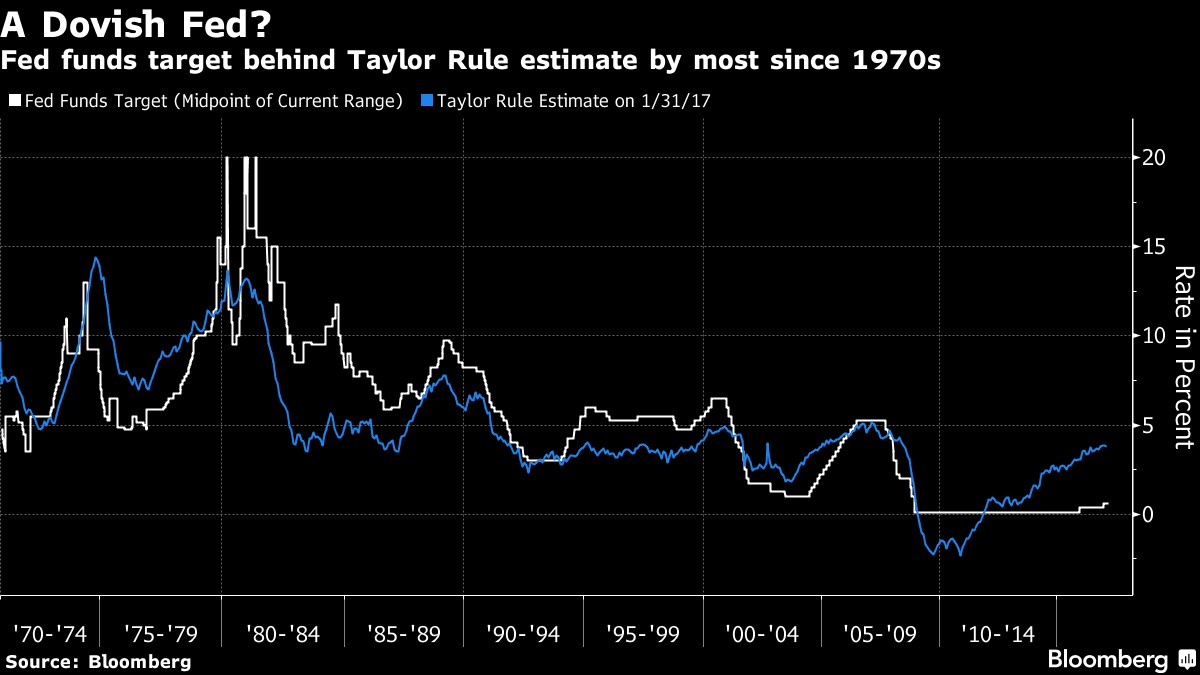
Fed Funds Rate Unusually Below The Taylor Rule
The new point to the discussion on monetary policy is shown in the chart below. It shows when the country is at full employment.
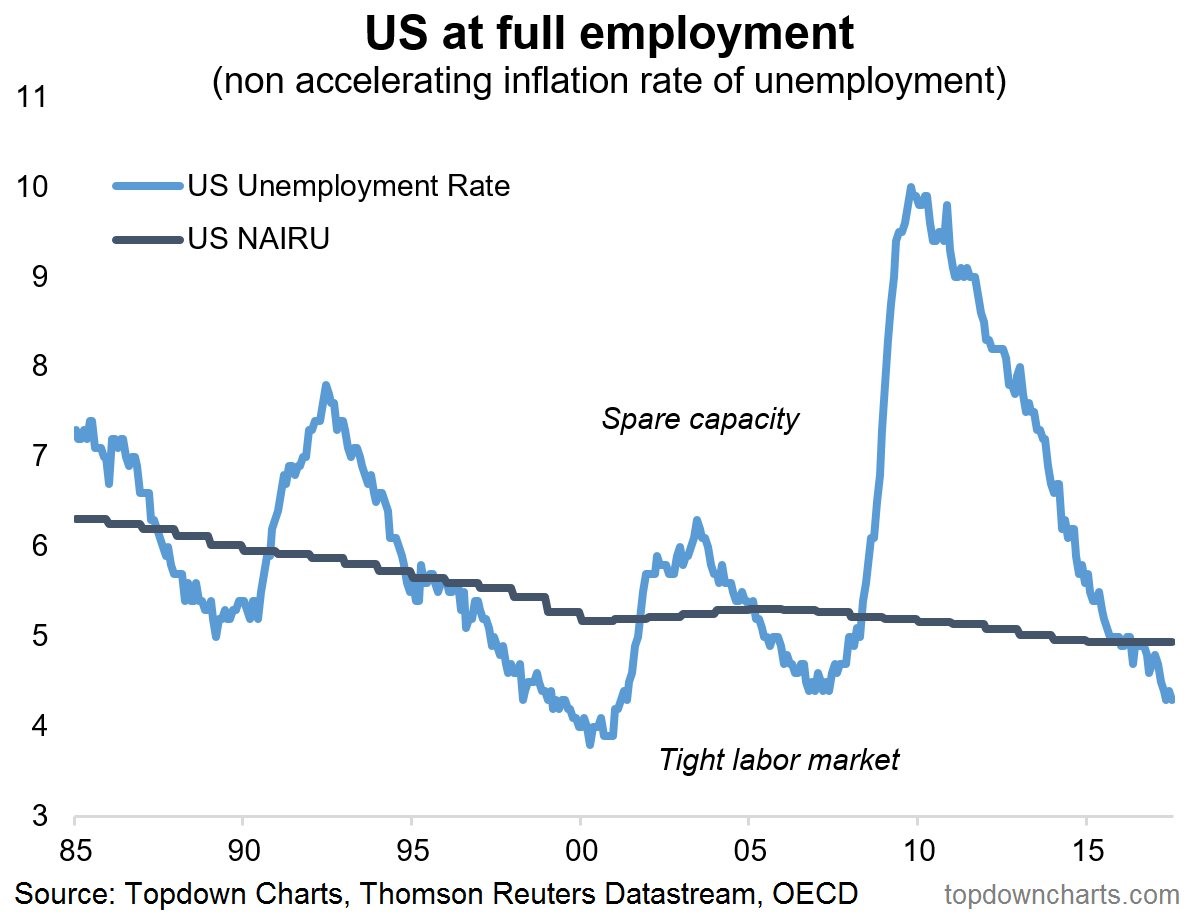
Slack In The Labor Market
The size of the recession explains why the streak of job growth has been able to continue unabated for so long. The economy only reached full employment in 2016, according to the unemployment rate which we do not think is accurate. The interesting aspect to look at is where the Fed Funds Rate was relative to the Taylor Rule when the economy was at full employment. As you can see, the economy was at full employment in 2005-2007 while the Fed Funds Rate was above the Taylor Rule from 2006-2007. The economy was at full-employment from about 1996-2001 in the previous cycle. This time, the Fed Funds Rate was even further above the Taylor Rule showing the Fed had a tight policy. Again, in 1987-1991 the economy was at full employment and the Fed Funds Rate was above the Taylor Rule. The spikes where the white line goes above the blue line occur when the labor market is tight. This makes sense because the Fed likes to raise rates when the economy is strong and inflation increases.
The chart below gives us an update into the relationship between the Fed Funds Rate and the Taylor Rule. Although there has been some convergence recently, the Taylor Rule is still above the Fed Funds Rate. The current funds rate is at 0.95% and the Taylor Rule is at 3.02%. The Fed is uniquely dovish in a general sense, but especially dovish when you consider the labor market is at full employment. It’s not surprising with that backdrop to see stocks soaring and volatility ceasing to exist.
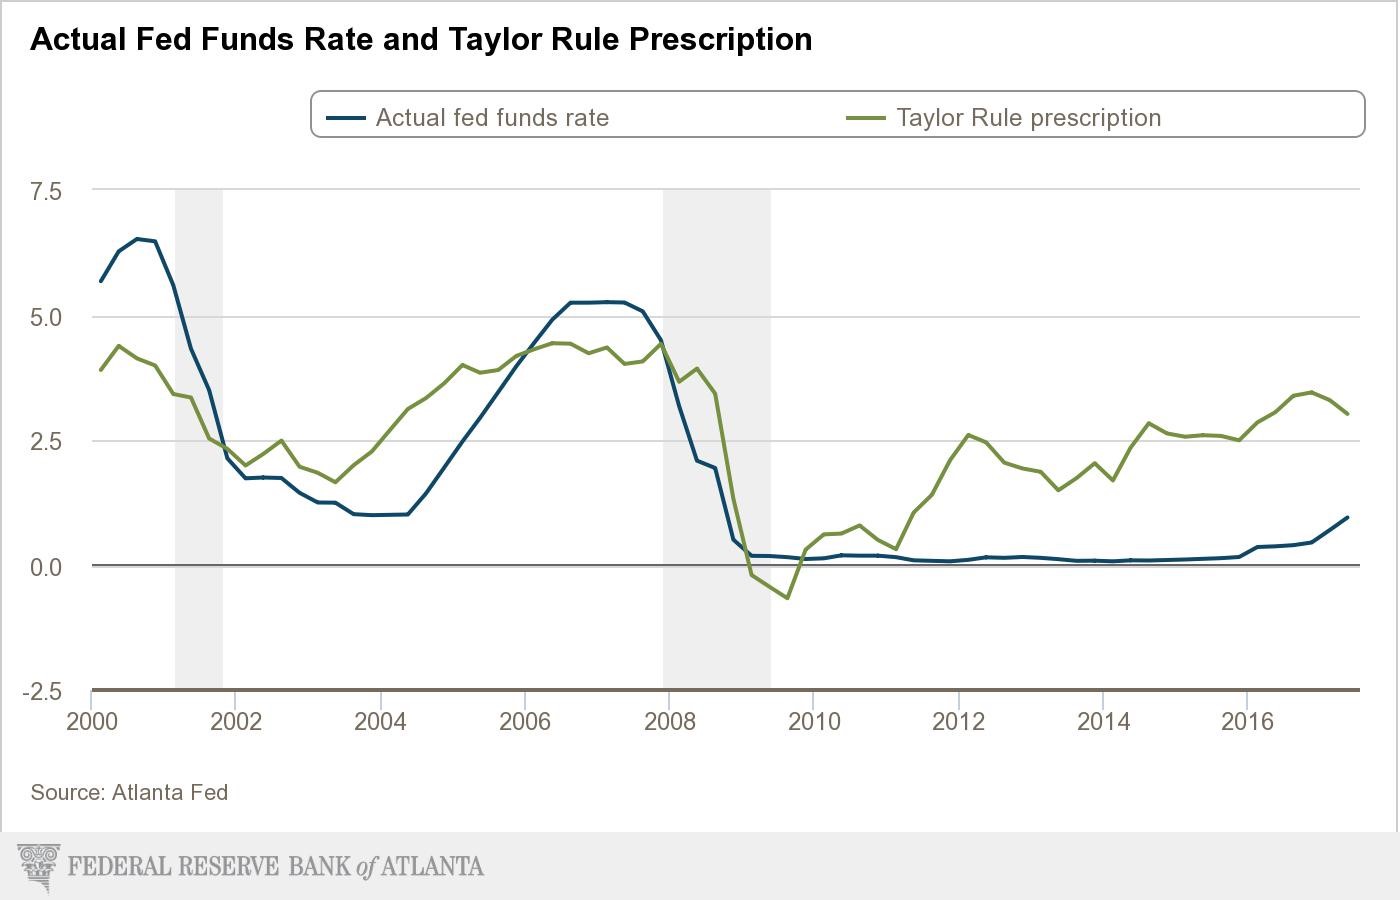
Fed Funds Rate And Taylor Rule Converging Slightly
The Fed has been able to have such an extreme monetary policy because inflation, as measured by the CPI, has been low, evidenced in the chart below. The wage growth, by most measures hasn’t reached previous cycle levels despite the record low jobless claims to population and the record long payrolls streak. With such low rates, you’d expect CPI inflation to be especially high, not subpar. Many economists think this is because of the labor slack. That’s the large spare capacity you can see in the chart which shows whether the economy is at full employment. This nirvana period could end for stocks once the wage growth drives inflation. Ironically, the consumer getting a raise could bring back stock market volatility.

10 Year Breakeven Inflation
As a bonus, the chart below shows the effect on European corporate bond yields after the ECB announced its corporate bond purchase program in early 2016. The program might be ending in 2018 which means a reversal in yields could be coming, disrupting the stability in financial markets. Global QE has allowed the financial conditions to improve even with Fed rate hikes. Not only has the Fed been relatively dovish, but its rate hikes have been numbed to the point that nothing has been done. It’s the equivalent of a child eating four bites of broccoli and then having 20 donuts after the meal. The child isn’t exactly a healthy eater.
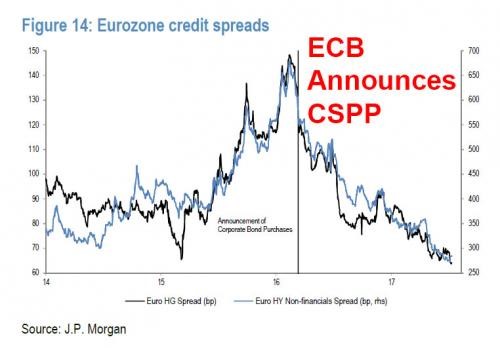
ECB Tightens Credit Spreads
Conclusion
Until now 2017 will be remembered as the quietest/calmest stock market ever. The reason for this is the central banks have very easy monetary policies with a strong labor market as measured by the unemployment rate which is created as a result of low inflation, as measured by the CPI. Greater inflation causing a tightening of monetary policy would end this nirvana. The issue is that not only would risks increase, but also valuations will normalize which could mean a large correction is coming as the Shiller PE has only been higher in the late 1920s, and early 2000s.
Have comments? Join the conversation on Twitter.
Disclaimer: The content on this site is for general informational and entertainment purposes only and should not be construed as financial advice. You agree that any decision you make will be based upon an independent investigation by a certified professional. Please read full disclaimer and privacy policy before reading any of our content.


