UPFINA's Mission: The pursuit of truth in finance and economics to form an unbiased view of current events in order to understand human action, its causes and effects. Read about us and our mission here.
Reading Time: 5 minutes
The economy has witnessed lower nominal wage growth than previous times in this phase of the business cycle when the unemployment rate was at current levels. Depending on how you calculate inflation and which type of industry and workers you look at, real wages have either grown modestly or have been stagnant. This is troubling for monetary policymakers and even more so for workers who may have been the contributing reason for the emergence of populist candidates such as President Trump and Bernie Sanders. The lack of wage growth has kept interest rates lower than the Federal Reserve wants them. The Fed wants to raise rates, so it has the operational leverage to cut them in the event of a recession, however disappointing wage growth has significantly altered those plans with rate increases occurring more sparingly. When the Fed talks about wanting inflation, it’s primarily referring to wage growth without commodity inflation.
Goldman Sees Labor Market Slack Tightening
The chart below is a breakdown of the divers of inflation according to Goldman Sachs.
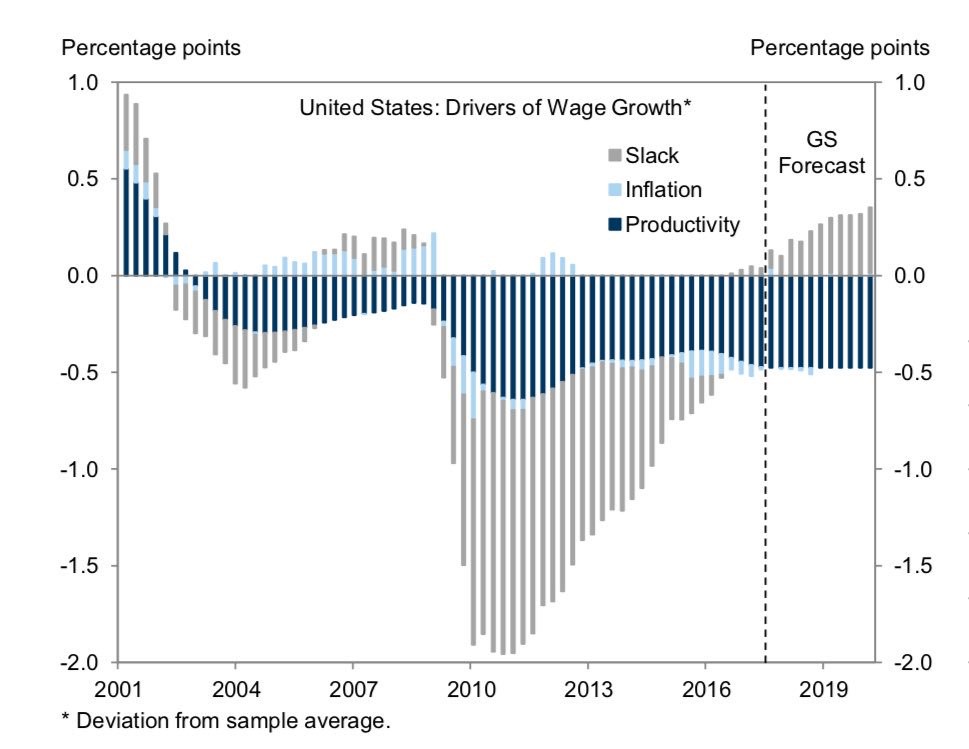
Slack Is No Longer Hurting Wage Growth
The new development in the labor market is that the slack is now tight enough to add to wage growth instead of impeding it. In other words, there was a surplus of workers, which caused wage growth to stagnate. Now there aren’t enough workers, which is a catalyst for higher wages. On the negative side, Goldman still sees the lack of productivity expansion as a catalyst which will hold wage growth back. Workers aren’t becoming more efficient, hence not justifying for corporations to increase wages. In the short-term the new tax legislation should help increase capex since it lets companies write off the cost immediately, which could increase productivity.
Latest Data Discouraging
Some of the latest data from 2017 has been discouraging. From the CPS Microdata report out of the BLS, the 3 month and 12 month moving average for wage growth make it look like it’s peaking.
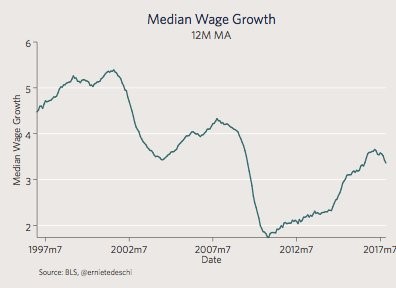
12 Month Moving Average Of Median Wage Growth
This data uses year over year changes in median wage growth from the same workers, so it’s not affected by short term composition effects (the changes in the types of jobs). It includes wage growth and pay increases from switching jobs.
The Atlanta Fed wage growth tracker is showing similar results as the growth ticked down from 3.4% in October to 3.2% in November.
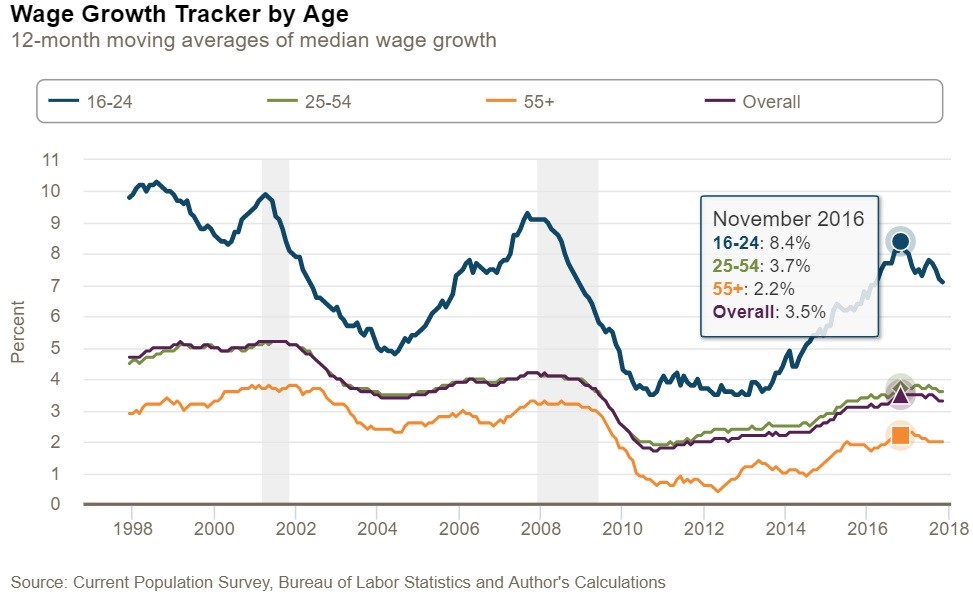
Young Workers Seeing Decelerating Wage Growth
There has been a sharp deceleration in female wage growth as it was 3.8% in August and as of November it was 2.8%. The 12 month moving average of the leisure and hospitality wage growth has fallen from 4.0% in November 2016 to 2.7% in November 2017. Manufacturing has been the best industry as its 3.5% wage growth is tied for the highest in this expansion. Last cycle, manufacturing growth peaked at 4.0% in April 2008. The age group with the sharpest deceleration in wage growth is workers 16-24. Wage growth fell from 8.4% in November 2016 to 7.1% in the latest report. Finally, the western, northern and central regions of the United States, which includes states like Missouri and North Dakota, has seen wage growth fall from 4.4% in November 2016 to 3.1%.
The chart below is another example of bad news in the past few months. It shows the wage rigidity of the labor force.
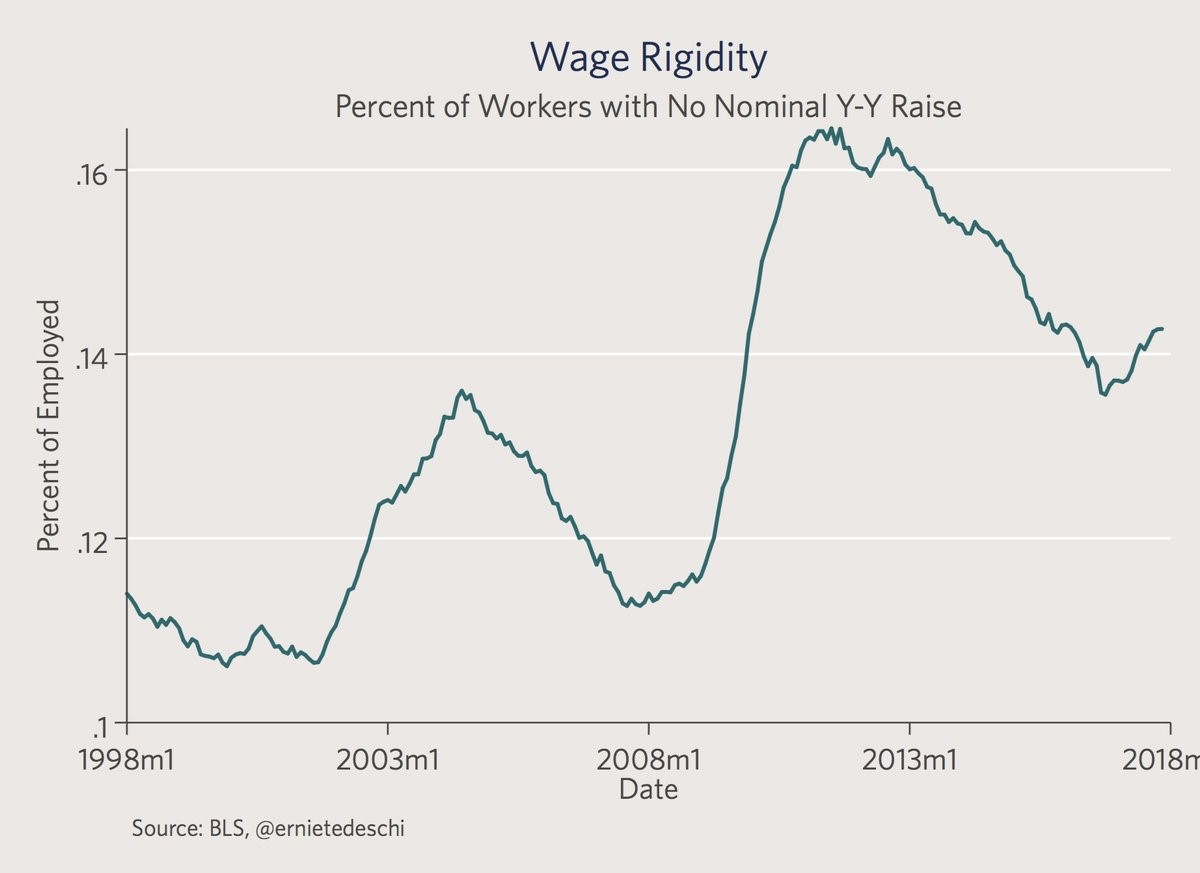
Wage Rigidity Has Been Increasing Lately
This metric measures the percentage of workers employed 1 year apart which have gotten no nominal wage increase. The chart shows this metric is increasing. This is bad news in concert with the other reports we mentioned earlier. The one aspect to keep in mind with this chart is that it’s easier to have workers with no nominal wage growth in this cycle than in the previous cycles because inflation is lower. The lack of a nominal wage hike is less painful with lower inflation. The weakening in the recent data makes it look like the cycle is peaking, but that may be an illusion. As we showed, Goldman Sachs’ forecast is optimistic based on the availability of labor in the labor force.
Metro Areas Have Different Labor Markets
One of the reasons it’s difficult for the FOMC to set monetary policy is because there is a divergence in the labor market, with some sectors performing well and others poorly. Doing a top down analysis is difficult when there’s so multiple trends developing under the surface of the headline. The chart below shows one example of how labor markets differ as it compares the unemployment rate of various metropolitan areas.
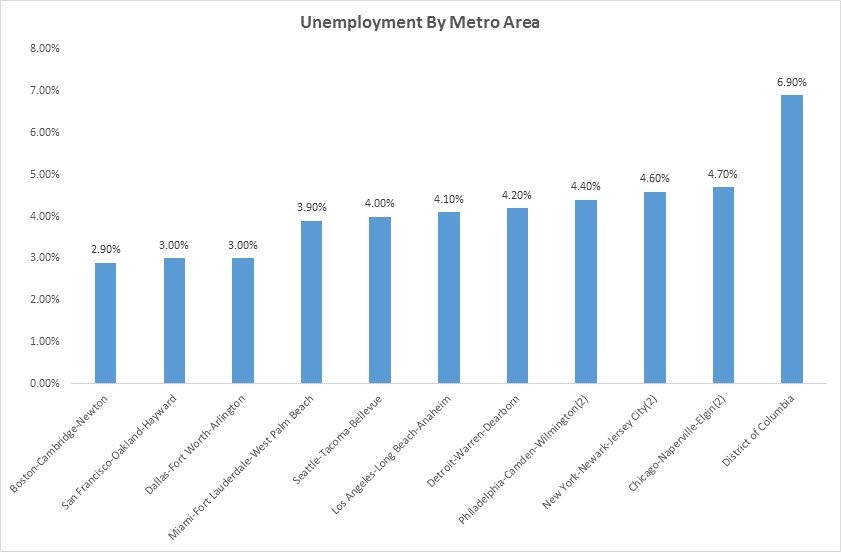
Unemployment Rates In Various Cities
As you can see, the District of Columbia probably has a great deal of slack in its labor market while Cambridge probably has such little slack that temporary workers are working full time. This is why you should always becareful generalizing everything as it comes to economics. The truth is generally not black and white.
Measurements Can Differ
Another aspect which makes labor market analysis difficult is the difference among various data sets. In the long run, these data sets differing for a short time don’t matter much. However, when you’re in the trenches making forecasts, it’s like trying to read an eye chart with glasses that don’t meet your prescription. The chart below is one example of recent data which doesn’t match.
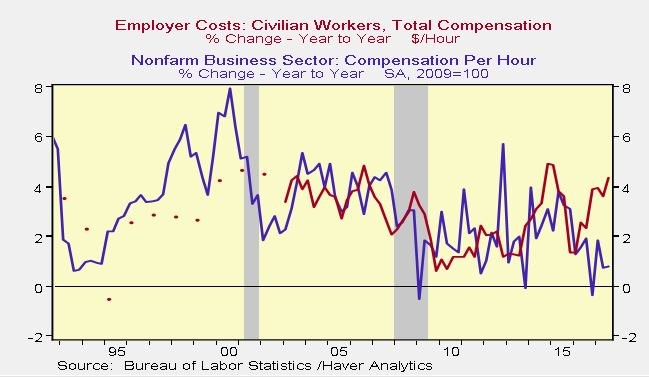
Two Measures Of Wage Growth Diverging
This chart shows the employer cost growth compared with the non-farm business sector compensation per hour growth. There are a few differences between the way the two indexes are calculated. The employer cost index excludes self-employed workers while the non-farm index excludes education and healthcare workers. The non-farm calculation is broader than the employer cost index because it includes money the worker gets which the employer doesn’t pay such as tips.
Conclusion
We discussed the drivers of wage growth. Measuring slack in the labor force is an inexact science because the number of people willing to work is difficult to calculate. It’s also challenging to determine what wages and which jobs would bring more people into the labor force. Goldman estimates that the labor slack has run its course which is good news for wage growth. If productivity were to increase, we’d see an abundance of real wage growth for the first time in this expansion. We then broke down the various microtrends within the overall Atlanta Fed wage growth index noticing how some workers are underperforming others. Finally, we looked at the ways in which it’s difficult to measure wage growth, namely dispersion among cities and dispersion among wage growth metrics.
Have comments? Join the conversation on Twitter.
Disclaimer: The content on this site is for general informational and entertainment purposes only and should not be construed as financial advice. You agree that any decision you make will be based upon an independent investigation by a certified professional. Please read full disclaimer and privacy policy before reading any of our content.


