UPFINA's Mission: The pursuit of truth in finance and economics to form an unbiased view of current events in order to understand human action, its causes and effects. Read about us and our mission here.
Reading Time: 5 minutes
The most curious part of the economy is that while GDP grew 4.3% in Q2 and consumer sentiment is near a record high, the housing market has weakened. We will delve into the weakness in this article. To be clear, you should try to avoid recency bias in which you compare this weakness to the previous financial crisis because the banks are in better shape to weather difficult financial circumstances, consumers have less leverage, and mortgage lending standards have been raised. Consumers causing a decline by balking at expensive housing isn’t close to the greatest financial crisis since the Great Depression, but it’s still not a great aspect of an economy which is considered by many to be doing really well.
The chart below sets the scene on housing.
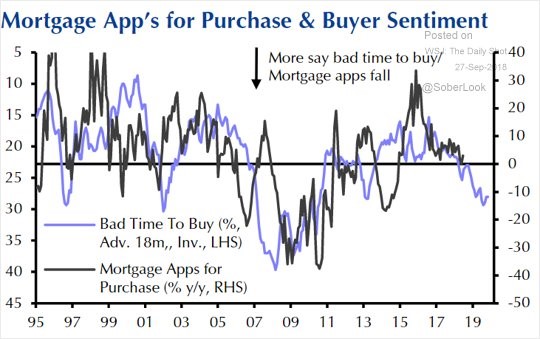
The percentage of people who think now is a bad time to buy a house is as high as it has been since the initial recovery after the crisis. This is used as a forward looking indicator for mortgage applications as it is advanced 18 months. The implication is mortgage applications will fall in the next 18 months. This isn’t an exact science because it depends why people are saying it’s a bad time to buy a house. If they think the economy is bad and housing is expensive, it’s a recipe for disaster. In this case we only have one of the two since consumers think the economy is great for home buying.
Rates Increase & Median Home Prices Fall
It’s also pivotal to see where interest rates are headed since a spike in rates would cause mortgage applications to fall. In a vacuum, even if the economy was great, high rates would cause problems. Realistically, the economy wouldn’t be perfect with rising rates. As you can see from the chart below, 30 year mortgage interest rates are at a 7 year high.
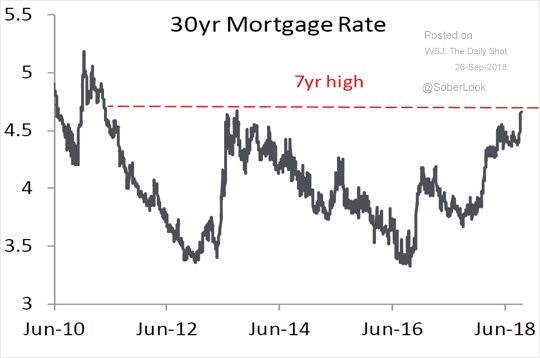
If new tariffs keep getting implemented by all parties involved, inflation could increase which would cause the Fed to raise rates and mortgage rates to rise. On a more direct basis, tariffs on building materials will increase home builders’ costs and housing prices. This will make the affordability issue even worse.
While the flat-lining growth in mortgage applications makes it look like the housing market is stagnant, some indicators show it is weakening already. As you can see from the chart below, the year over year median sales price for new houses fell about 1% in Q2 2018 which is the weakest growth since Q2 2011. It’s only the 2nd decline since 2009. It’s very rare for new houses to have a year over year decline in median prices outside of a recession.
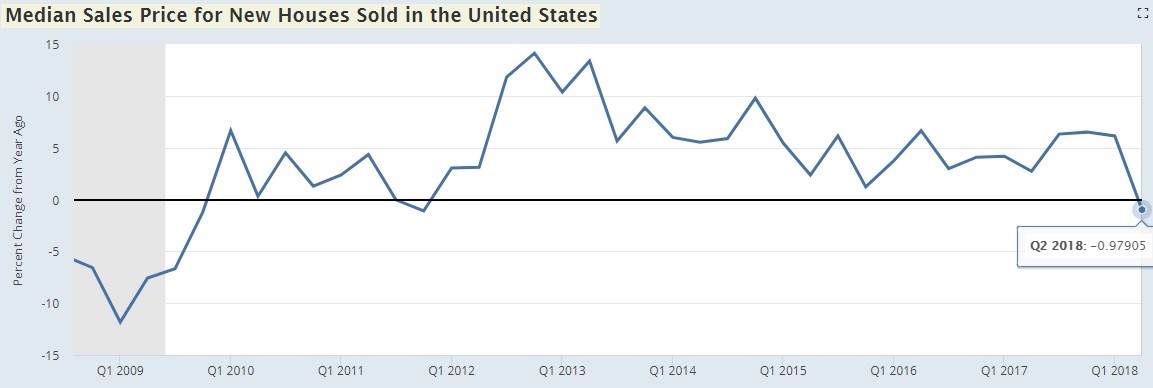
The positive side is that lower house prices solves the affordability problem. If interest rates are steady, the bottom in prices will come quicker than if they rise. Obviously, a bottom without much of a decline can only occur if the labor market stays strong. To be clear, the peak was $343,400 for new median sales in November 2017 and in August prices were at $320,200. The recent low was $309,500 in June.
Shelter Saw The Biggest Spending Increase
In this expansion, shelter prices have driven CPI. It doesn’t take much for it to drive CPI because it is the biggest component; it makes up about 40% of the index. Part of the problem are zoning regulations which prevent multi-family housing from being built in cities which desperately need affordable housing and not expensive single family housing.
This isn’t a unique situation in the past few decades. As you can see in the chart below, shelter has increased from 12% of household spending in 1972 to 17% in 2017, it was 15% in 1990. To be fair, houses have also gotten bigger, so it’s partially a choice for people to spend more on shelter.
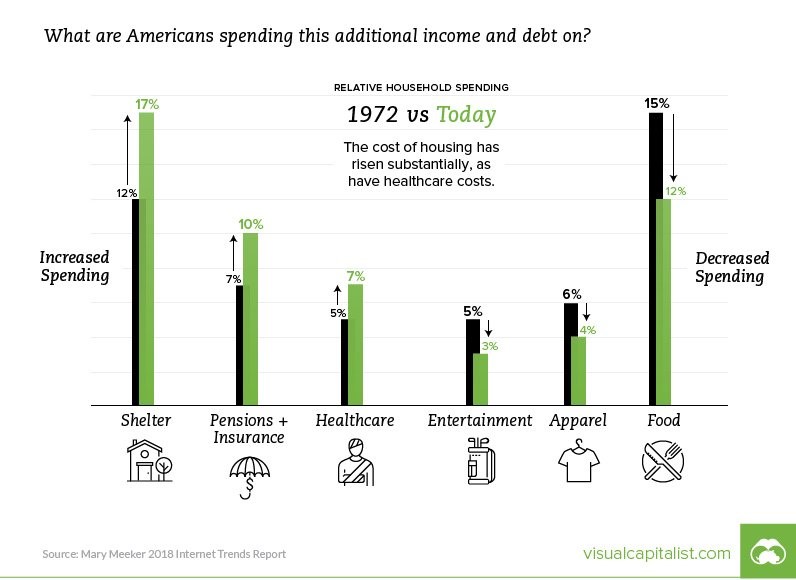
Spending on taxes changed from 15% in 1972, to 9% in 1990, to 15% again in 2017. The chart above shows food, entertainment, and apparel have all witnessed declines. Food is down the most since it fell from 15% to 12%. That entire decline is since 1990.
Uneven Housing Recovery
We showed a chart in a previous article which had real wealth declining from 2007 to 2016 for all Americans outside of the top 10%. Anyone who had their real wealth decline didn’t own much stocks as prices have soared even adjusting for inflation. The next asset which can generate wealth is housing. Median new housing prices peaked at $262,600 in May 2007. Adjusting for inflation, that’s the equivalent to $303,970 in 2016 dollars and $319,344 in 2018 dollars. That means housing has risen slightly more than inflation if you take the numbers from the peak. It’s the same for 2016.
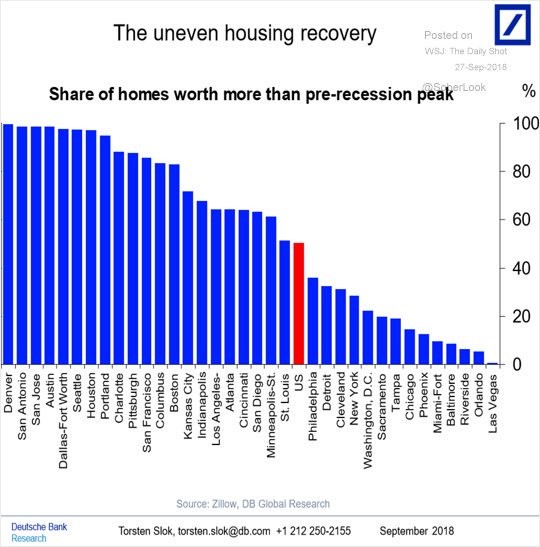
Following that thought, the obvious question you should ask is how it’s possible that most household’s real wealth declined from 2007 to 2016 if housing prices recovered. There are a few ways this is possible. If a homeowner defaulted on their loan in the housing crisis, he/she received all the pain without the recovery. If a person lost their job in 2008 and couldn’t find one for a few quarters, that was a big hit to wealth gains. Another factor is seen in the chart below, the housing recovery has been uneven which means not everyone saw their house price surpass its pre-recession peak. If a person lives in Denver, their net worth is probably higher than in 2007, but if he/she lives in Orlando or Las Vegas, it probably isn’t.
Conclusion
Hopefully we showed you unique perspectives of the housing market. Housing prices are weakening because housing is unaffordable especially with rising interest rates. Some might even go as far as saying that although households aren’t indebted as much as last cycle, the housing market is still unstable because it’s supported by low interest rates. The basis for that point is the assumption that rates will go much higher. We can’t guarantee a prediction where rates will go, but we can tell you buyer sentiment is negative which is a bad sign for the housing market.
Have comments? Join the conversation on Twitter.
Disclaimer: The content on this site is for general informational and entertainment purposes only and should not be construed as financial advice. You agree that any decision you make will be based upon an independent investigation by a certified professional. Please read full disclaimer and privacy policy before reading any of our content.


