UPFINA's Mission: The pursuit of truth in finance and economics to form an unbiased view of current events in order to understand human action, its causes and effects. Read about us and our mission here.
Reading Time: 5 minutes
What makes economics more frustrating than investing is that the truth is never completely settled. When you buy a stock with the plan to hold it for 5 years, the price in 5 years is guaranteed to tell you whether it was a good investment or not. Economic analysis is never complete because there will always be divergent opinions about the labor market, strength of the consumer, etc. We’re not worried about setting policy as investors and analysts. However, it’s almost as difficult to make investments based on economic analysis as it is to set policy because both scenarios require knowing the effects of each policy as well as understanding how constantly changing, and often unpredictable, external factors impact the economy.
To quickly bring this conversation from the abstract to reality in a simplified example, if you knew fiscal stimulus through tax cuts and spending would boost growth, it could have helped you go overweight US small caps in 2018. There’s much debate on whether the costs of the stimulus are worth the benefits which appear to be a boost in growth. Either way that analysis directly led to investment returns. Getting back to the point of how difficult it is to do work in economics, we can never know the exact effect of the fiscal stimulus because there isn’t a way to test policy in a vacuum. We have changes to monetary policy, tariffs, and global growth to contend with.
Reason To Be Optimistic About Income Growth
Just because economic analysis is difficult, doesn’t mean we don’t try to do it. Usually the tough questions unlock the most profits because the obvious is mostly priced in. That’s not to say there aren’t examples where ‘easy money’ can be made.
One of the most hotly contested topics is the strength of real incomes because political charged people act as if whoever is in power has complete control over the results. Therefore, whether the economy is good or bad for median Americans can determine who wins elections according to this fictitious assumption. In a complex mixed economy there are numerous factors affecting results.
Most economists and analysts tend to support the narrative that real income growth hasn’t increased enough for median Americans. Since the top 1% and 10% have seen their income and wealth increase, if real median incomes are flat lining, it’s a problem. As we mentioned in a previous article, if you look at real median income per person instead of per household, it looks better because households have shrunk.
As you can see from the AEI chart below, median real income has increased with both spouses working.
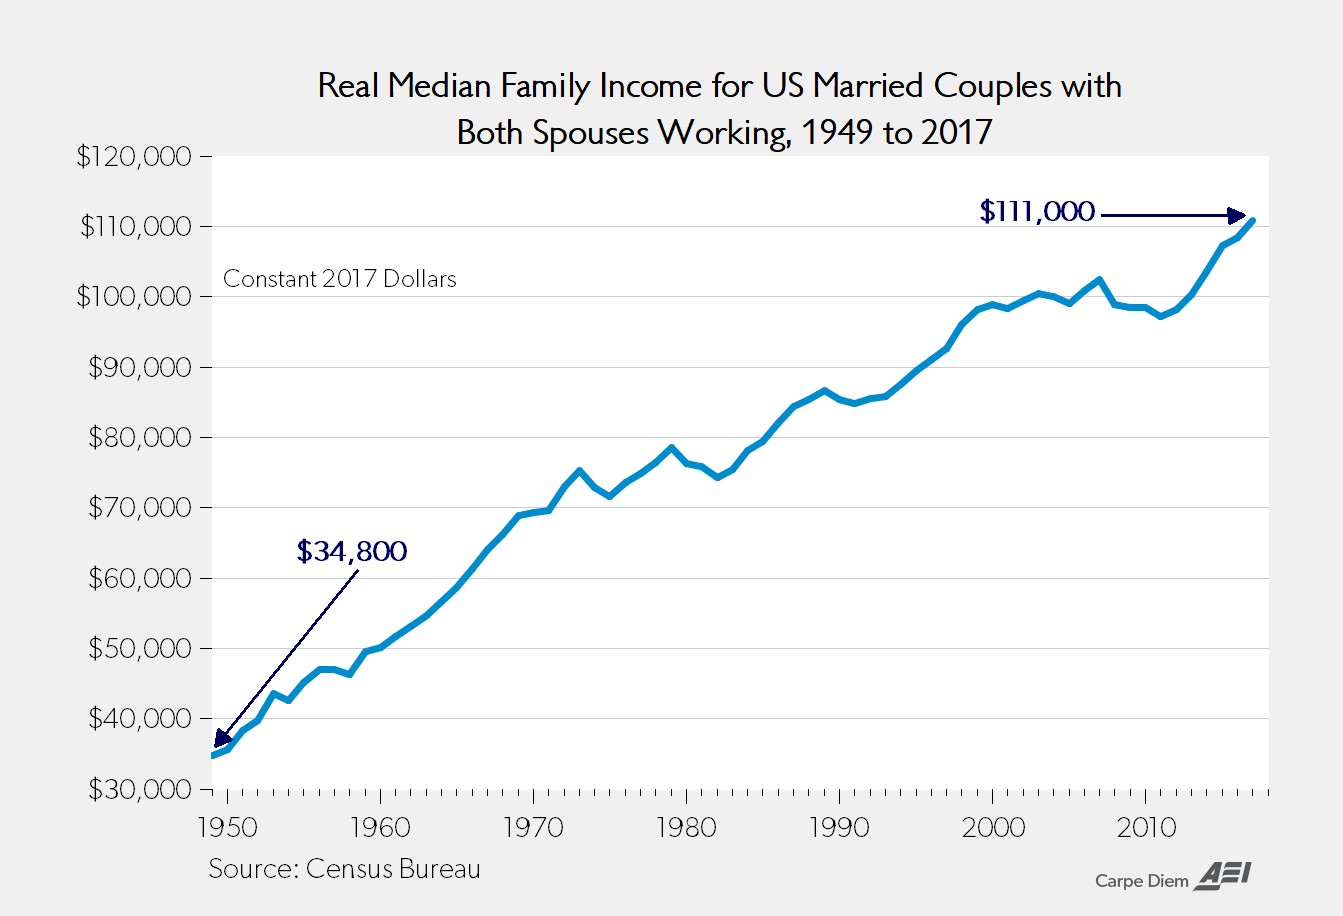
Since 1963, median income has more than doubled from $54,700 as females are earning more money. Since 2000, the increase is about 12% as wages were stagnant between 2000 and 2010, but have resumed higher since then. To be clear, both spouses working means expensive child care for infants unless other family members can take care of the kids while the parents are working.
Is Inequality Increasing? It Depends On The Metric
The chart below is very unique because it contradicts the narrative that inequality is increasing rapidly.
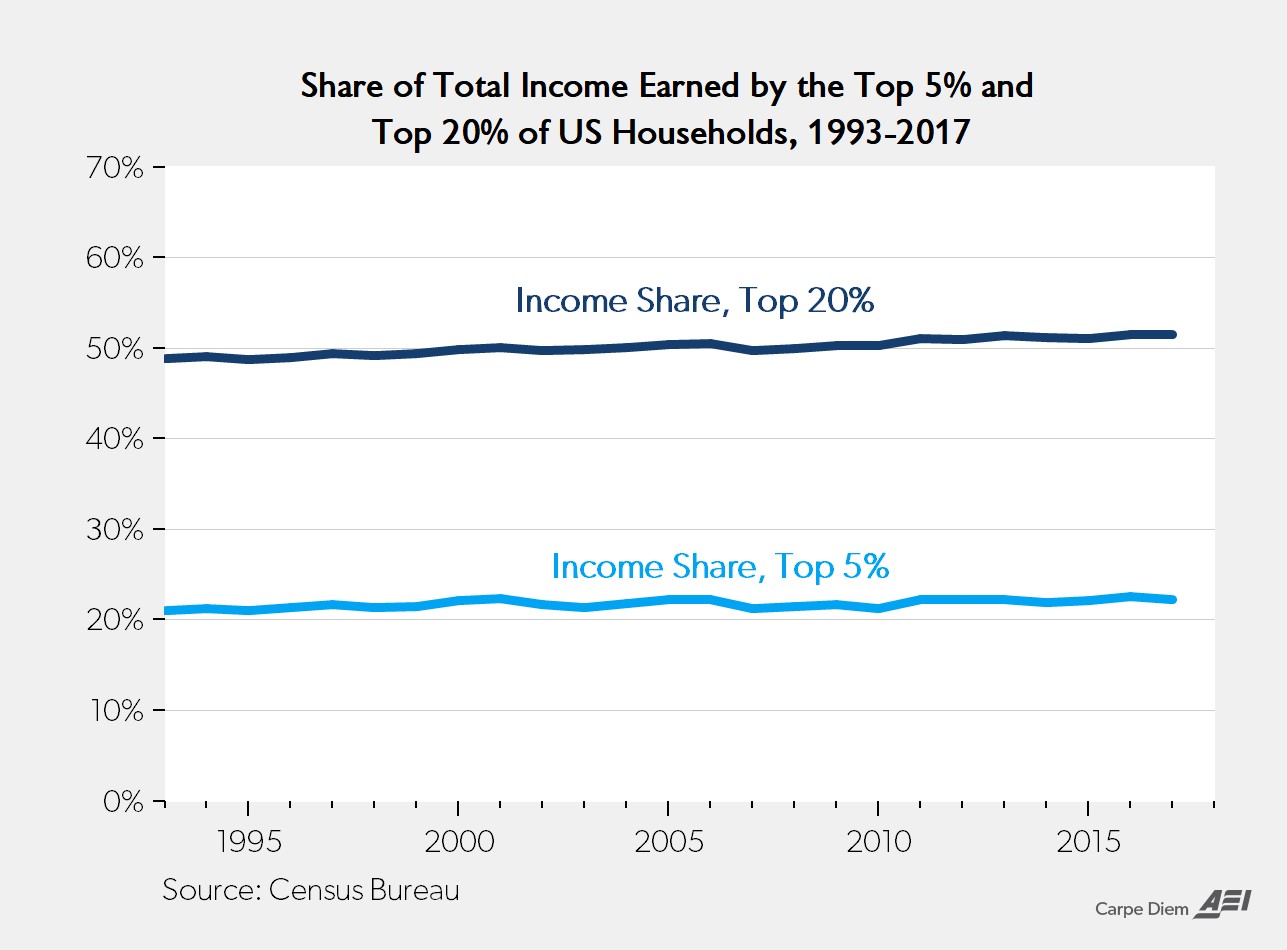
The income share of the top 20% of earners has only increased from 48.9% in 1993 to 51.5% in 2017 according to the American Enterprise Institute. The income share of the top 5% earned only increased from 21% in 1993 to 22.3% in 2017. These results mean the Gini index of inequality has barely increased from 1993 to 2017. It increased from 0.454 in 1993 to 0.482 in 2017. This is all data from the U.S. Census Bureau.
One explanation for the ongoing push to improve equality is that while incomes aren’t becoming much more unequal, wealth is improving for the richest Americans, while it’s not for the poorest. The Bloomberg chart below is only updated until 2016, so the numbers might look a bit better now. However, it gets the job done.
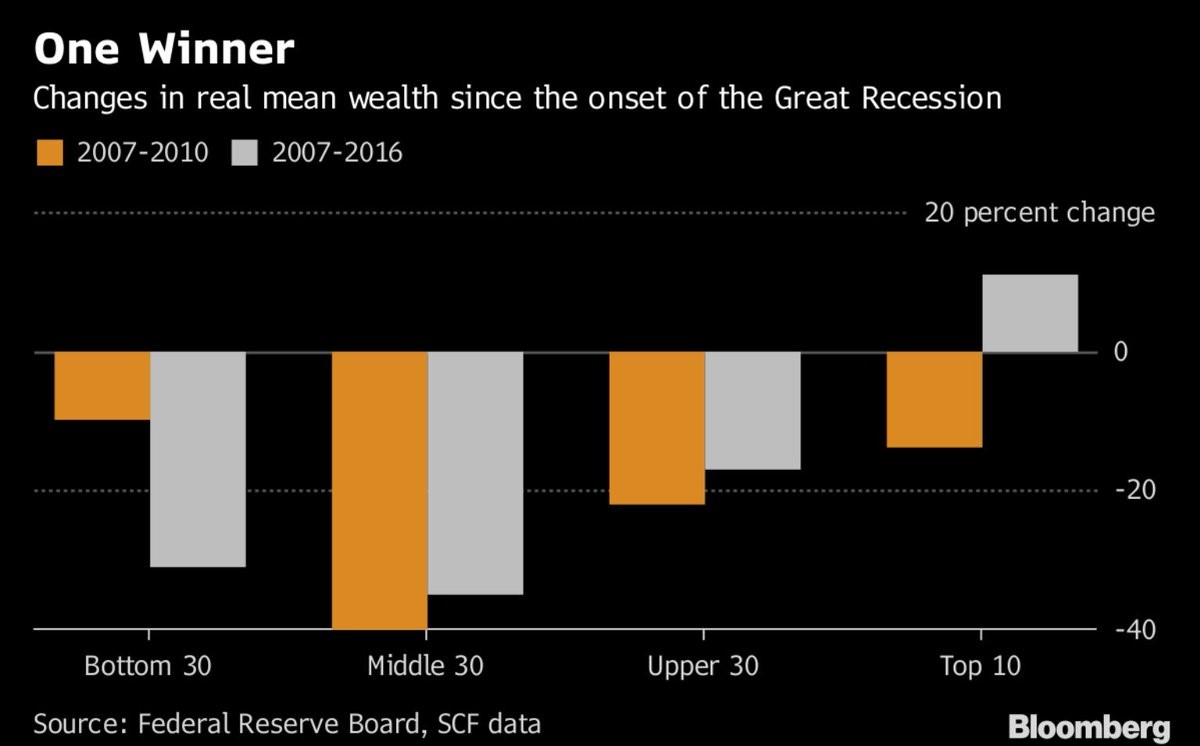
The only group which had increased real average wealth from 2007 to 2016 is the top 10%. The middle 30% saw nearly a 40% drop in wealth. This chart top ticks the housing market which means it is the worst possible period. However, it’s still disconcerting to see wealth wasn’t restored 7 years into the recovery. Equities have driven household wealth this cycle. The problem is the bottom 50% don’t own stocks, so they don’t get the wealth benefit.
Increasing FICO Scores
Because this cycle has been a deleveraging event for households, the national average credit score has improved. As you can see from the chart below, the average FICO score is up from 686 in 2009 to 704 in 2018.
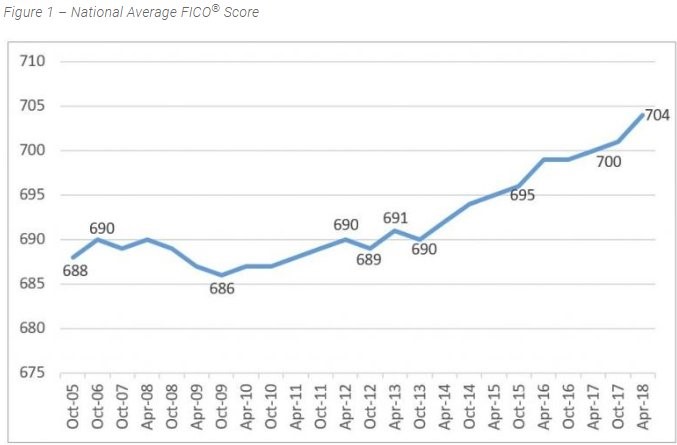
Instead of trying to get people into houses they can’t afford, the better bet is to get consumers out of debt so they can afford to buy a house. It’s amazing that when the average FICO score was 688 in 2005, the home ownership rate was about 69%, while the average FICO score is now 704 and the home ownership rate is about 64%. There weren’t stringent lending standards in the mid 2000s.
Benefits Taking Share From Wages
It’s important to realize that when workers get benefits, they are rescinding potential wages. To be clear, getting benefits instead of wages isn’t a bad thing; it’s simply a tradeoff. One advantage to getting health insurance through an employer is premiums can be paid on a pre-tax basis, while that isn’t allowed for individual plans. The table below shows in the past 20 years, employers have leaned towards compensating workers through benefits over wages.
Private wages as a percentage of worker compensation fell 3.2% to 69.6%, while insurance increased 2% to 7.9%. Government workers had an even bigger shift as wages fell 7.9% to 62.4% and insurance increased 4% to 11.9%.
Conclusion
We showed the argument for why income inequality isn’t increasing and real median income is increasing. That’s an unusual perspective which doesn’t get much attention. The situation isn’t perfect, however, because people in the bottom 50% aren’t profiting from the bull market because they don’t own stocks. It’s easy to say these people should be investing small amounts with cheap robo advisors, but they don’t have the financial literacy nor much excess cash to do so. On the bright side, the average national FICO score has increased as households have deleveraged. Finally, workers are getting paid with benefits and less from wages in 2018 compared to 1998.
Have comments? Join the conversation on Twitter.
Disclaimer: The content on this site is for general informational and entertainment purposes only and should not be construed as financial advice. You agree that any decision you make will be based upon an independent investigation by a certified professional. Please read full disclaimer and privacy policy before reading any of our content.


