UPFINA's Mission: The pursuit of truth in finance and economics to form an unbiased view of current events in order to understand human action, its causes and effects. Read about us and our mission here.
Reading Time: 5 minutes
The Personal Income and Outlays report is widely followed because it provides information on the two most important factors in macroeconomics: inflation and consumer spending. Even though it is delayed, the Fed watches this inflation reading the closest, thus making it very important. Month over month August PCE inflation was only up 0.1% which missed expectations for 0.2% growth. It was up 2.2% year over year which also missed expectations by 0.1%. This follows along with the CPI and PPI misses from August. Inflation decelerated even though wage growth hit a cycle high. Core PCE inflation was flat month over month which missed estimates by 0.1% and up 2% year over year which met estimates.
As you can see from the hedgopia chart below, even though August had the easiest inflation comparison of the year, core inflation only managed to meet the Fed’s target.
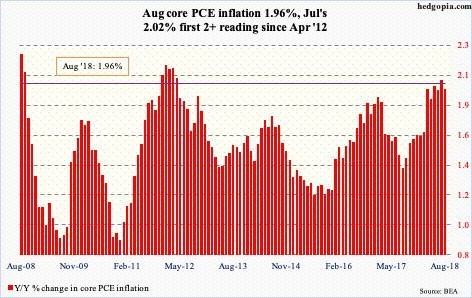
From July 2017 to August 2017, core inflation fell 9 basis points, but from July 2018 to August 2018, inflation fell 6 basis points. Despite easier comparisons, inflation decelerated.
4 Drivers Of Inflation
It’s important to follow the 4 drivers of year over year inflation in the intermediate term. They are the year over year comparisons, the labor market, oil prices, and tariffs. The year over year comparisons will get tougher in the rest of the year and early 2019. You can see in the chart that inflation has rarely stayed high because comparisons get tough.
Hourly wage growth hit a cycle high in August, but inflation is still below the cycle peak in 2012 when the labor market had much more slack. However, wage growth is only going to get stronger in 2019 as the slack diminishes. In the PCE report, wages were up 0.5% month over month.
Oil prices only affect headline inflation and not core inflation. Because oil prices are so volatile they can have an outsized effect on headline inflation. The recent drivers of oil prices are OPEC refusing to increase production and the American sanctions on Iran which could cut 1.7 million barrels of production per day.
The tariffs haven’t impacted inflation yet because they have been too small. Most effects are being felt by firms that purchase primary metals. This will change as China has put 5% to 10% tariffs on an additional $60 billion worth of American goods and America has put 10% tariffs on an additional $200 billion worth of Chinese goods. Merrill Lynch raised its 2019 core PCE forecast to 2.2% from 2.1% because of the tariffs. JP Morgan raised its core PCE projection by 0.2% and said the Fed may raise rates 4 times instead of 3 because of this increase in inflation.
Personal Consumption Growth Expected To Be 3.5%
Month over month personal income growth was 0.3% which missed estimates by 0.1%. Income growth was hurt by a decline in interest income and a marginal gain in dividend income. Including inflation and taxes, incomes were up 0.2%. The savings rate stayed at 6.6%. The savings rate is higher than wealth gains imply. When you combine the high savings rate and decreased leverage this cycle, consumers look like they’re in good financial shape.
Consumer spending growth was 0.3% month over month which met estimates. Durable goods spending fell 0.1%. This was driven by weakness in auto sales. Vehicle sales won’t get the same bump in September as experienced last year because the destruction from hurricanes wasn’t as bad this year as it was in 2017. Energy catalyzed the 0.5% growth in spending on non-durable goods. This will probably increase in September as oil prices were up even more. High oil prices could eventually turn into a huge negative for consumer spending if the labor market shows any signs of weakness. Spending on services was up 0.4% for the 2nd straight month. Real spending was up 0.2%.
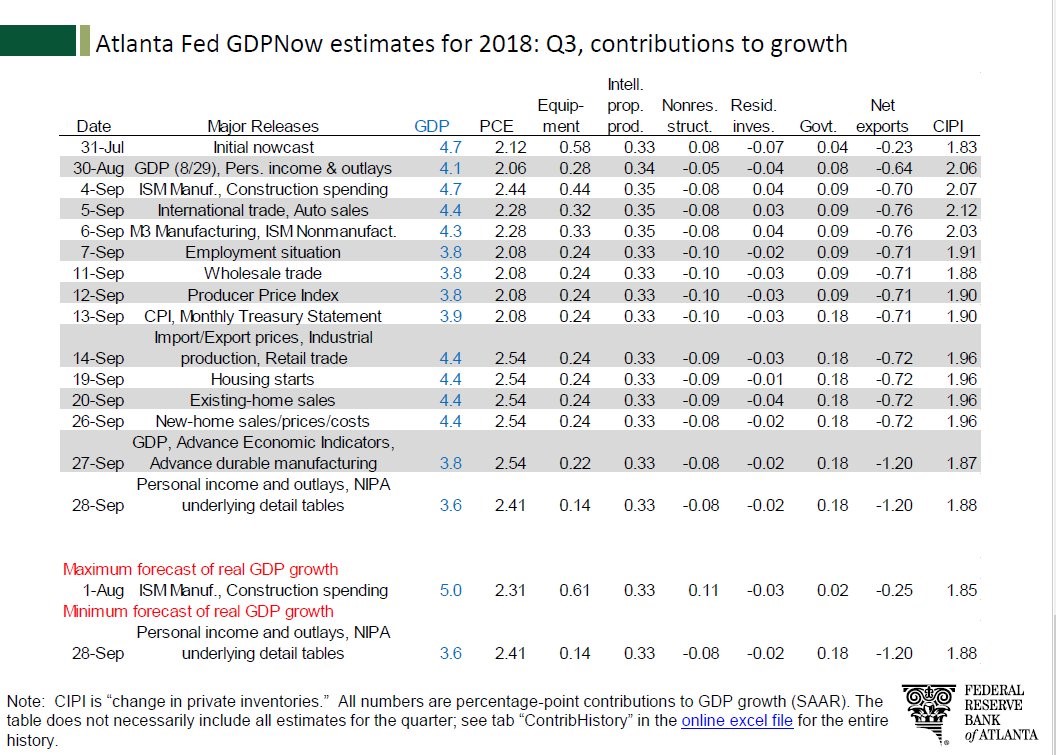
The personal income growth in this report caused the GDP Nowcast to lower its estimate for real personal consumption growth in Q3 to 3.5% from 3.7%. It was 3.8% in Q2. (The latest update estimates growth to be 3.7%.) The table below shows the changes to the Atlanta Fed Nowcast which is very accurate late in the quarter. It expects 4.1% GDP growth. It’s optimistic since the CNBC rapid update, which averages 13 GDP growth estimates, expects 3.2% growth.
Global Trade Growth Estimate Falls
Bearish investors will be the first to point out that inventory investment is driving Q3 growth. However, it hurt Q2 growth. This evens out in the end, but makes growth uneven. Specifically, inventory investment hurt growth by 1.17% in Q2. The GDP Nowcast has inventory investment helping growth by 2.14%. Trade will probably be a bigger drag on Q3 growth because the Q2 monthly average trade deficit was $67.6 billion and the Q3 average deficit so far is $74 billion. There was a big boost in exports in Q2 as firms tried to get out in front of the tariffs. This also depleted inventories. That temporary action is reversing in Q3.
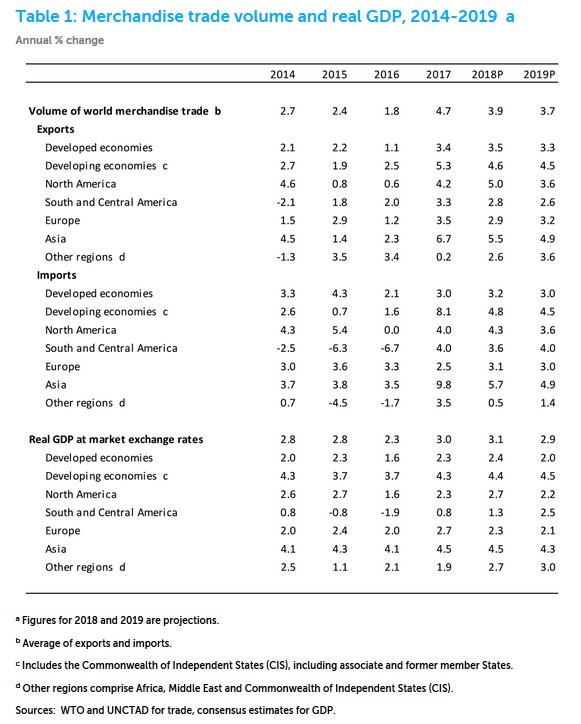
The weakness in trade growth is catalyzed by a combination of weakening global growth and tightening restrictions on trade as America has increased tariffs and trade partners have responded in kind. As you can see from the table above, the WTO finally lowered its forecast for 2018 global trade growth from 4.4% to 3.9%. That’s a 1.2% growth deceleration from 2017. The estimate for 2019 fell from 4% growth to 3.7%. Developing Asian economies are seeing the quickest deceleration in import and export growth.
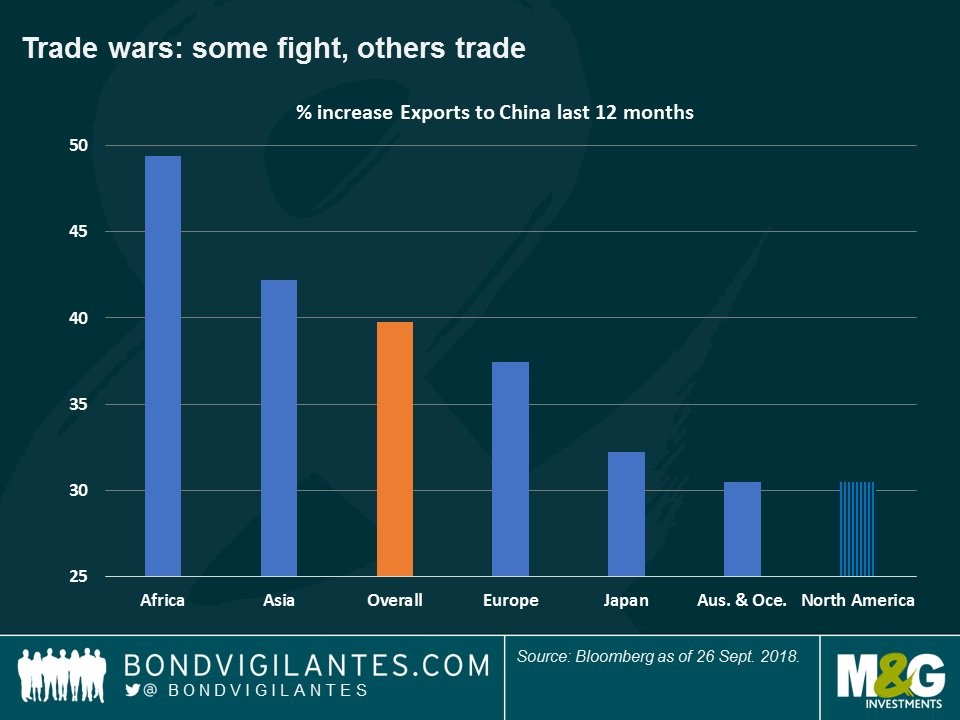
The chart below shows the increase in export growth to China in the past 12 months. African growth is close to 50%, while North American growth is only about 30%. North America has a bigger base which makes it more difficult to grow. Trade wars will limit future American exports to China.
Fed About To Get Contractionary
2% core PCE inflation is exactly the Fed’s target. Based on that point alone, you wouldn’t expect hawkish policy. However, the Fed is increasing its pace of rate hikes with 4 in 2018 because it fears the labor market heating up. In a previous article, we mentioned the Fed eliminated the term ‘accommodative’ from its statement. The chart below explains why.
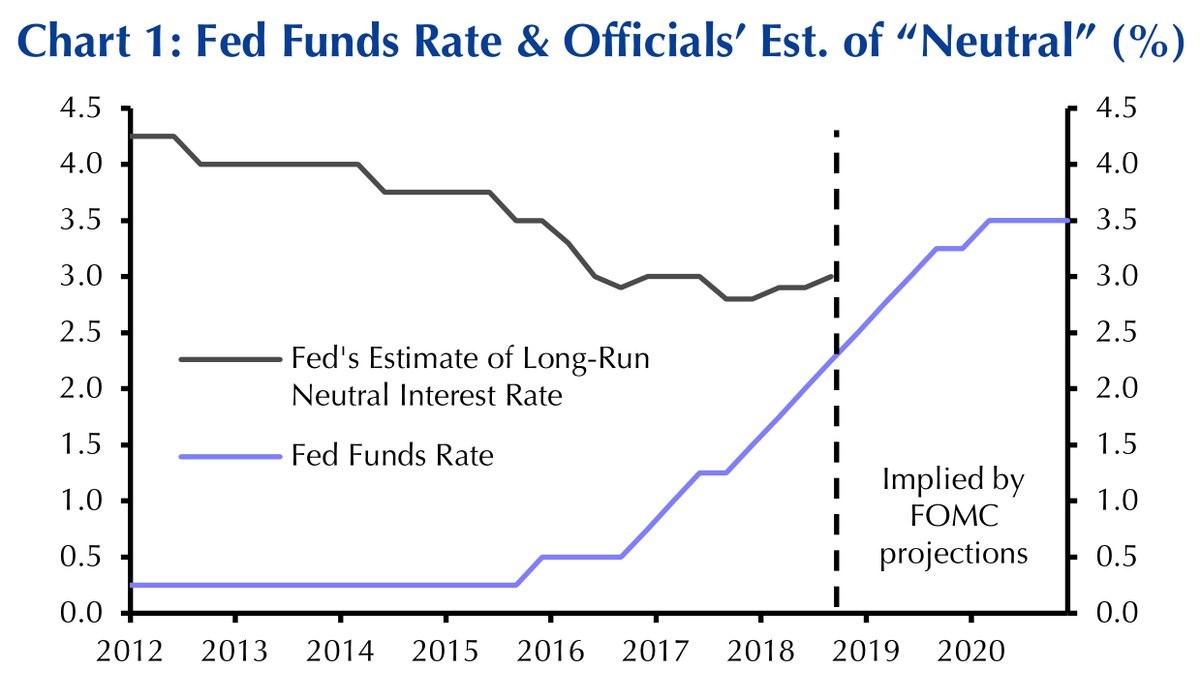
The Fed funds rate is close to the neutral rate, meaning policy is nearly neutral. It could become contractionary by the end of 2019 if rate hikes continue. That will pressure the economy just as the stimulative effect from the tax cuts and spending increase declines.
Conclusion
Inflation is contained, but it could increase in 2019 because hourly earnings growth is accelerating and the tariffs will bring higher prices. Even though the Fed said it would be fine with inflation above 2% because the cycle average should be 2% and it has spent most of this cycle below 2%, the Fed is on pace to set contractionary policy by next year. This along with the fiscal stimulus wearing off could catalyze a slowdown in 2019.
Have comments? Join the conversation on Twitter.
Disclaimer: The content on this site is for general informational and entertainment purposes only and should not be construed as financial advice. You agree that any decision you make will be based upon an independent investigation by a certified professional. Please read full disclaimer and privacy policy before reading any of our content.


