UPFINA's Mission: The pursuit of truth in finance and economics to form an unbiased view of current events in order to understand human action, its causes and effects. Read about us and our mission here.
Reading Time: 5 minutes
Heading into the September Fed meeting, there was a 100% chance the Fed would raise rates at least once (25 bps) and there was even a mid single digit chance it would raise them 50 basis points. Even though the Fed did exactly what was expected by raising the Fed funds rate by 25 basis points, the S&P 500 inched higher and then fell into the close on Wednesday. It fell 0.82% from the peak, after the hike was announced, to the close. The 10 year yield declined 5 basis points to 3.05% which is interesting because it was closing in on the cycle high of 3.11%.
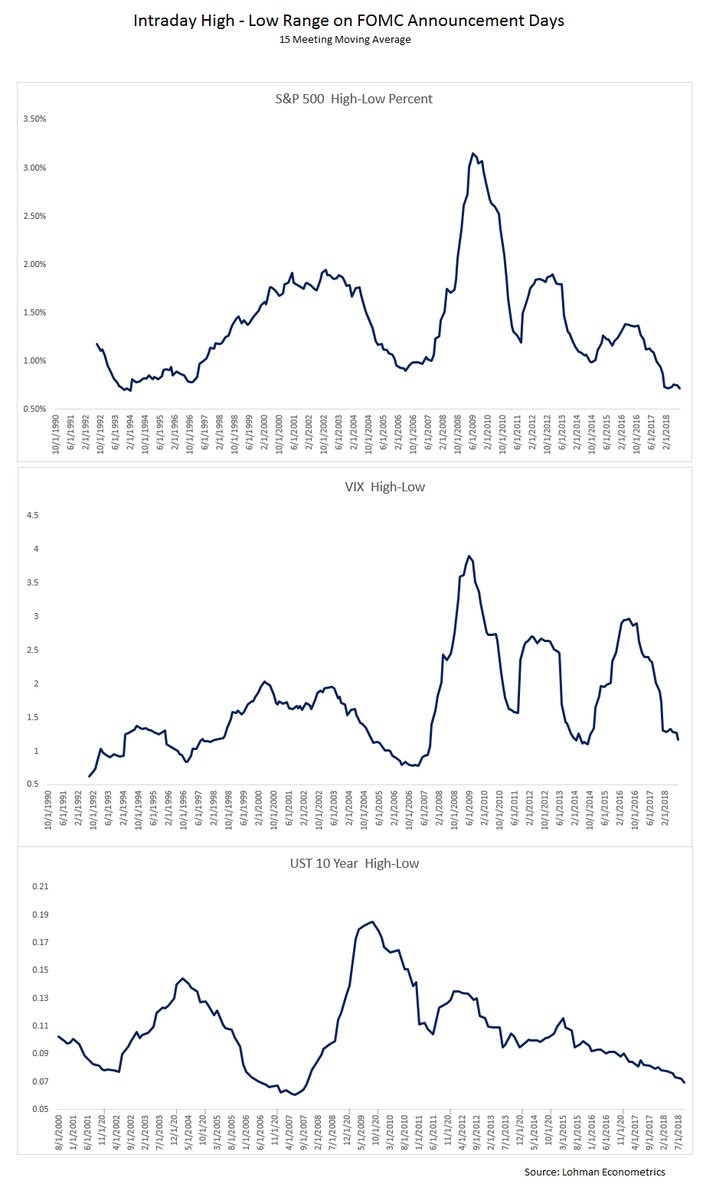
The charts below show there recently hasn’t been much volatility in the 10 year bond and stocks on FOMC announcement days. This goes along with the overall decline in volatility since the 2016 election. There probably won’t be volatility on these days until investors feel the hike cycle is near its end.
The sector action was interesting because the utilities and real estate, which like low rates, fell, and the financials, which like high rates, also fell. Because the 2 year yield only fell 1 basis point, the difference between the 10 year and 2 year yield fell to 22 basis points, meaning the curve flattened. Once the 2 year yield is higher than the 10 year yield, the curve will give off a recession signal.
Balance Sheet Unwind Increases
The chart below shows financial conditions have gotten easier while rates have increased. That’s not a surprise because the fiscal stimulus is more powerful than the potential contractionary effect rate hikes are having. The effect rate hikes have on the economy is an estimate, but by most accounts, current rates aren’t high enough to slow the economy.
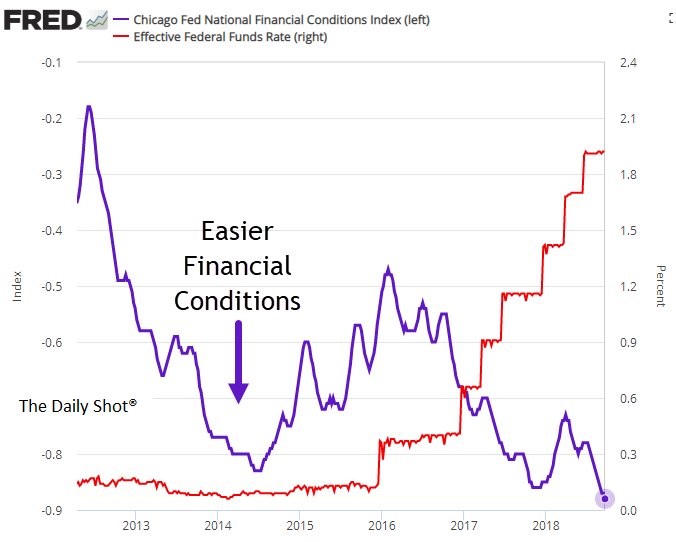
This chart could also include the balance sheet which has declined since the unwind has started, while stocks have increased. You could have gotten a hint that stocks could rally and financial conditions could ease with an unwind because stocks did well after QE ended. The Fed announced the continuation of the unwind schedule; it will unwind the balance sheet at peak speed, which is $50 billion per month, starting in October.
The Fed has been behind schedule with its unwind, so it will need to go even faster with this latest announcement. At this speed, it will take until 2021 for the balance sheet to get below $3 trillion. The goal is between $2.5 trillion and $3 trillion. The debate on what balance sheet is truly normal will pick up next year as it becomes center focus for investors.
Fed Not Accommodative?
Perhaps the biggest news from this FOMC statement and press conference was that the Fed eliminated the sentence where it claims monetary policy is ‘accommodative.’ While you might think returning rates to neutral and potentially contractionary in the future is hawkish, it’s actually dovish because it signals the Fed thinks the rate hike cycle is closer to ending. This rate hike brought the Fed funds rate above year over year core PCE growth. The Fed follows core PCE the closest. As you can see from the Bloomberg chart below, real rates are now positive for the first time this cycle.

There are two caveats with saying real rates are now positive. First, the latest core inflation data is from July, so comparing the Fed funds rate in late September to July inflation isn’t optimal. The August PCE report comes out September 28th. The expectation is for year over year core PCE inflation to stay at 2%, but it could increase because of increased medical costs and because the August comparison is weaker than the July comparison. Second, core PCE inflation is only one metric. Traditionally, we use headline CPI to measure real wage growth, so why not use it to measure rates? Since headline CPI was up 2.7% in August, with that deflator real rates are still negative.
The Fed’s Projections
There hasn’t been a recession with real rates below 2%, but if the Fed follows its projected path, real rates may not get that high. The table below shows the Fed’s expectations for GDP growth, unemployment, inflation, and the Fed funds rate.
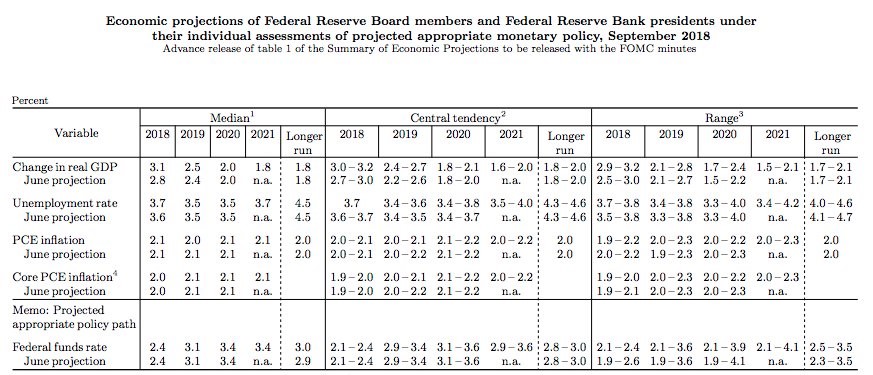
Starting at the bottom, the Fed sees the Fed funds rate getting to 3.4% this cycle. If core PCE inflation stays at 2%, real rates won’t get to 2%, meaning we could see the first recession without 2% real rates. The Fed is on the hawkish side compared to the market as the OIS forward curve expects 52 basis points of hikes in the next 12 months and not much more after that.
Much has been made about the fact that the Fed thinks 2021 GDP growth will fall to 1.8% and the unemployment rate will rise to 4.5%. That’s not the Fed covertly claiming there will be a recession in 2021. We can’t be surprised that the 2021 projections are the same as the longer run guidance, because they are both the same thing. Plus there’s a potential for an economic slowdown because the fiscal stimulus will lose effect by then. Investors should only focus on the 2018 and 2019 changes. The expectation for 2018 GDP growth increased 0.3% to 3.1% and the unemployment rate projection increased 0.1% because of the data which has been reported since June. For 2019, almost nothing changed, meaning investors shouldn’t have a knee jerk reaction to this meeting.
Powell On Tariffs
Tariffs could increase inflation which would force the Fed to raise rates quicker than expected. As for now, there hasn’t been an effect on inflation. In Powell’s statement he pointed this out. He said,
“The tariffs might provide a basis for companies to raise prices in a world they’ve been very reluctant and unable to raise prices … We don’t see it in the numbers [yet].”
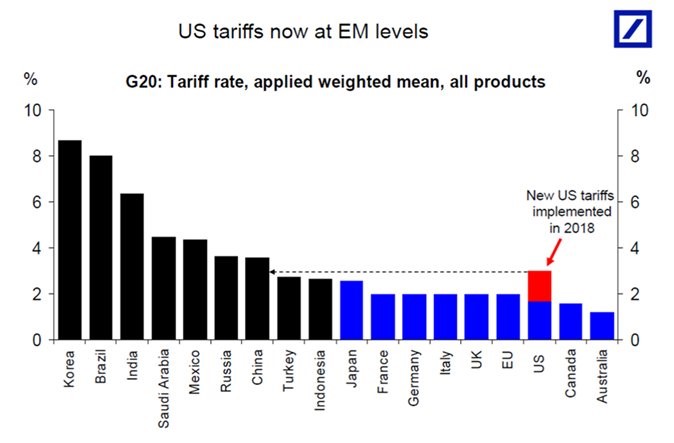
The chart below shows the weighted mean of various countries’ tariffs. With the new tariff’s the American tariff rate is higher than all the developed markets listed below. If this spat with China continues, we will start to see prices go up in the overall inflation metrics.
Conclusion
The yield curve flattened after the rate hikes which isn’t a surprise. The surprise is how it happened. You’d expect near term rates to rise more than long term rates, but instead long term rates fell more than short term rates. The curve will tell you when the Fed will finish hikes and more importantly when the next recession might occur. The steepening in September gave the Fed more room to raise rates. If the 10 year yield falls, we’ll see an inversion quickly.
Have comments? Join the conversation on Twitter.
Disclaimer: The content on this site is for general informational and entertainment purposes only and should not be construed as financial advice. You agree that any decision you make will be based upon an independent investigation by a certified professional. Please read full disclaimer and privacy policy before reading any of our content.


