UPFINA's Mission: The pursuit of truth in finance and economics to form an unbiased view of current events in order to understand human action, its causes and effects. Read about us and our mission here.
Reading Time: 5 minutes
Ever since the economy started weakening in 2007 all the way until the Fed’s first hike of this cycle in late 2014, the Fed’s main concern has been boosting economic growth and improving employment. There has been mediocre success on the growth front, primarily a function of demographics, but luckily the fiscal policy stimulus through tax cuts and increased spending should spur growth in the short-term in 2018 and possibly 2019. The Fed started its hike cycle because it didn’t want to have rates at zero as the cycle matured so it needs to raise rates in order to cut them in the next recession. The Fed is also worried about increased inflation at the end of this cycle. The Fed would rather start raising rates a few years before the inflation than need to play catch up. As a reminder, inflation is a decrease in purchasing power, which is not something you should strive for. The higher the real inflation, the greater the decline in purchasing power.
From 2014 until 2018 the Fed was hiking rates for those two reasons as there hasn’t been much of a threat of inflation, as measured by the CPI and PCE in the intermediate term. However, that situation could change in the next year if the labor market slack is eliminated and commodities prices soar like they often do at the end of the cycle. We’ve seen oil rally this year, but the overall commodities index is still low. To put it in one sentence, the Fed’s job will get much more interesting in the next year if inflation increases steadily and the yield curve flattens more. There could be a point where the Fed chooses between inverting the curve or allowing inflation to stay above its target. That would be the first time in years where the Fed is in a bind. The charts below show the flattening across various durations.
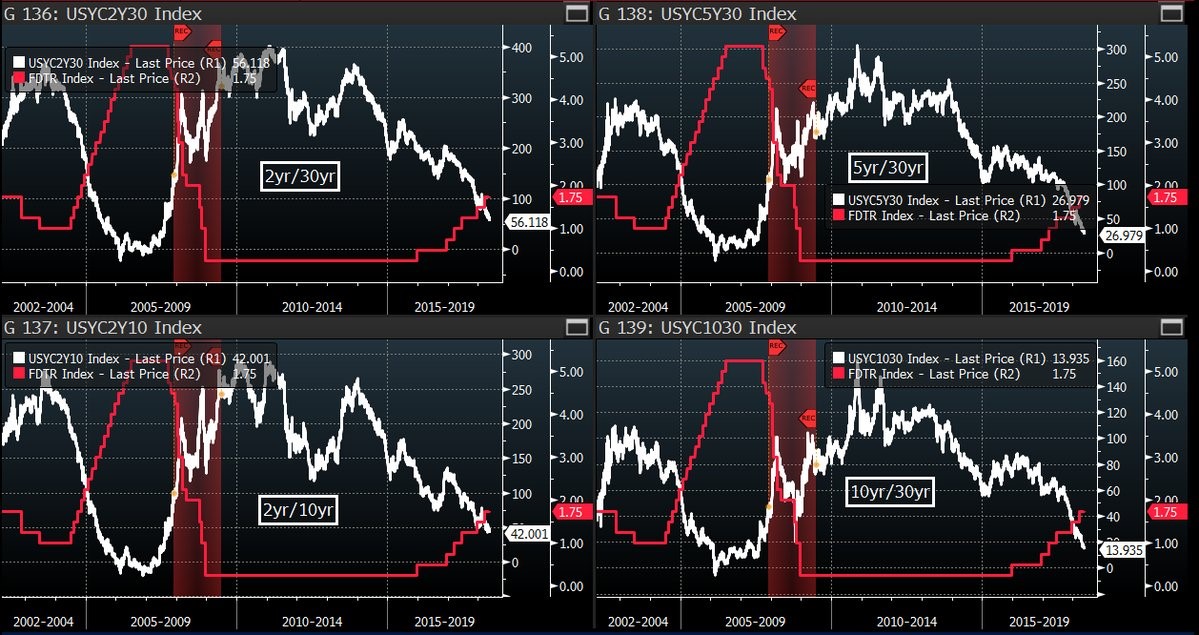
Source: Twitter @TheBondFreak
Inflation Soft In April
Even though inflation has been below the Fed’s target for the first 4 months of 2018, there have been fears of elevated inflation earlier this year as investors like to extrapolate current data onto the future. If inflation continued at that pace for the rest of the year, it would be a problem, but it has decreased which has allowed stocks to rebound following the February turmoil.
The chart below shows the last 2 months of data from the main inflation reports.
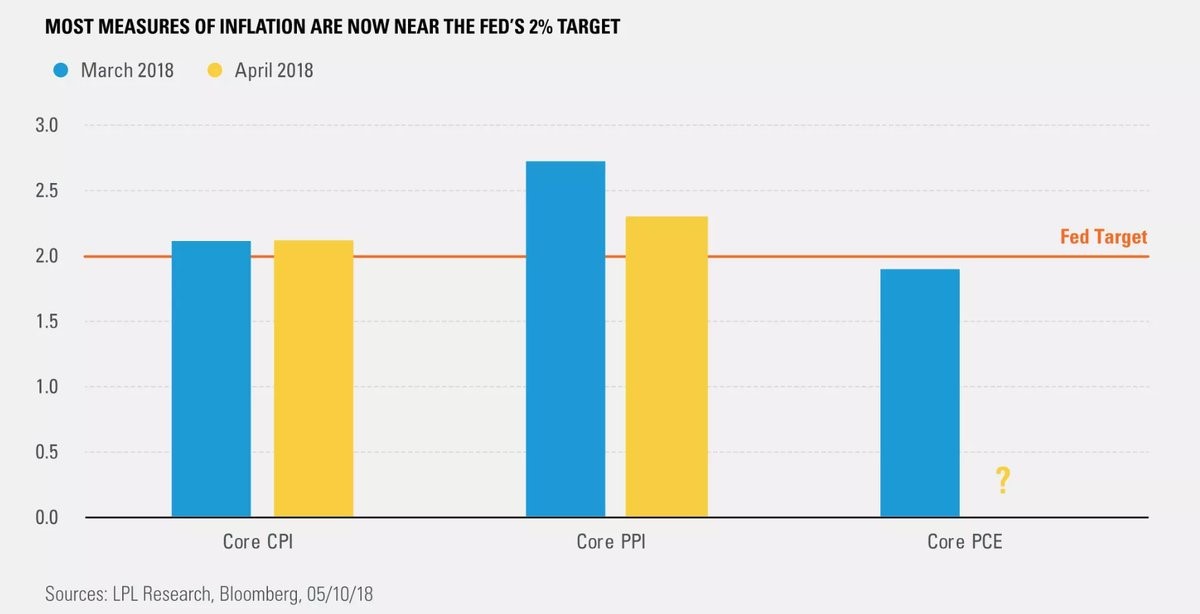
Source: LPL Research
The Fed specifically targets the core PCE. The April CPI and PPI reports have come out, but the PCE doesn’t come out until May 31st. It’s the most important report, but also the most predictable because we already have a lot of data from all the other reports by the time it comes out.
Specifically, the year over year core CPI was 2.1% in April which missed estimates for 2.2%. The headline number met estimates at 2.5% as gas prices were up 13.4% year over year. The PPI-FD was more disconcerting as year over year core growth fell from 2.7% to 2.3%. The headline number fell from 3% to 2.6%. This is even while the tariffs pushed steel prices up 7.9% year over year and aluminum up 11.9%. The worry about inflation causing the Fed to raise rates quicker than expected has diminished.
Blackrock’s Inflation Estimate
Just because inflation won’t be a problem in the next month or two doesn’t mean we stop analyzing it. Just like the Fed gets ahead of inflation, investors need to do so as well as they need to prepare for future monetary policy and sector rotations. As a reminder, markets are forward pricing mechanisms, therefore inflation expectations, and not inflation itself, are significant factors in predicting future price movements. BlackRock has a model for predicting inflation in the next 6 months. The core CPI is currently at 2.12%, but BlackRock’s model is at 2.39% There are base effects in play meaning the comparisons are weak.
The chart below shows BlackRock’s model for the all-important core PCE.
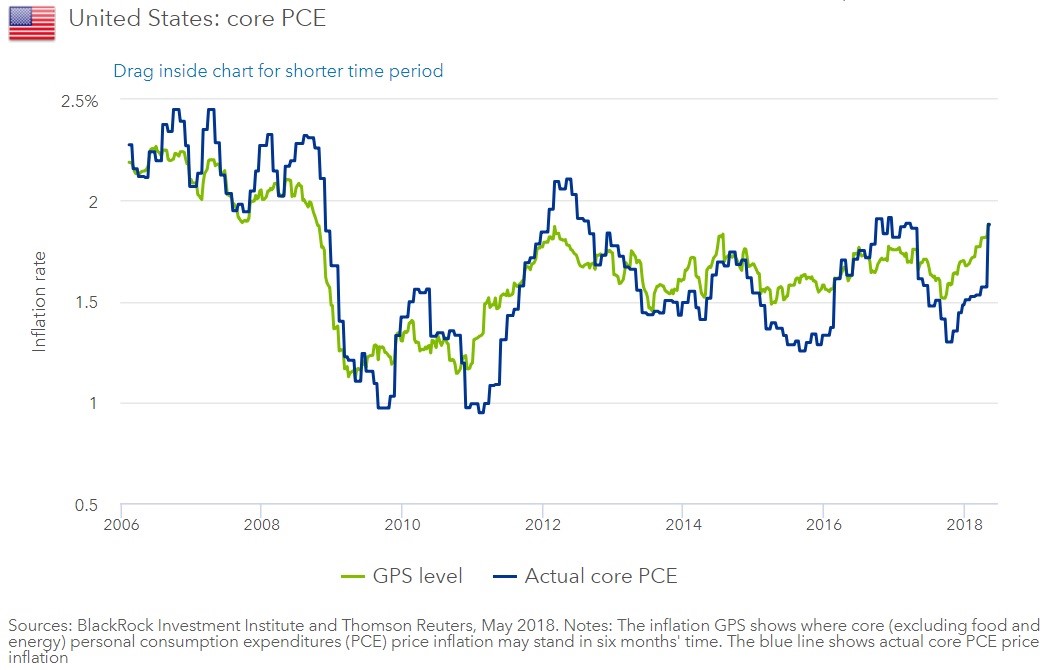
Source: BlackRock
The current 6 month forecast is exactly the same as the current rate: 1.88%. BlackRock’s model has often led the core PCE. This implies the inflation will stay near the Fed’s 2% target. The base effects seem to be strong as core PCE fell from 1.86% to 1.61% in April to May 2017; it increased from 1.57% to 1.88% in April to May 2018. The base effects will be a tailwind for year over year inflation until October.
Specifics Of The CPI Report
Let’s look at the specifics of the report to see if there are any trends we can spot. The chart below shows the used car prices compared to auction prices. The 1.6% decline in used car prices was the biggest drag on core CPI. The price of used cars had been increasing at an accelerated clip ever since the hurricanes as cars were destroyed, eliminating supply and boosting demand. The chart aims to use the Manheim auction prices advanced 3 months to forecast where used car prices are headed.
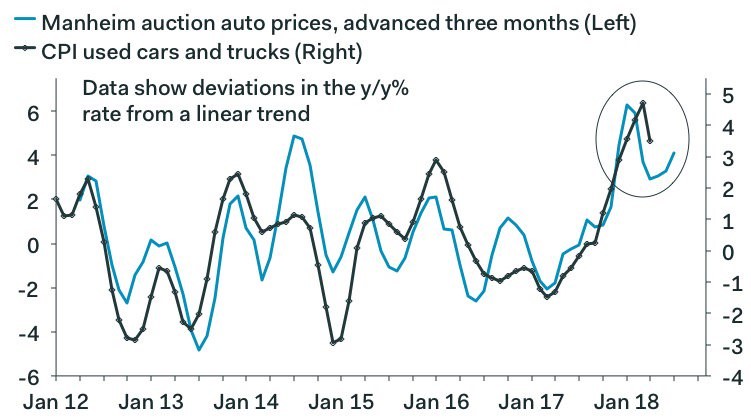
Source: Twitter @IanShepherdson
The two seem to be highly correlated, so it’s a reasonable forecasting tool. You can see, the auction prices have been increasing slightly which implies the price of used cars will do better than April’s report. That could boost core CPI in the coming months.
The chart below does a great job of separating where the inflation is coming from. The main catalyst of inflation has been the price of rent. The services inflation including rent, but excluding energy services was 2.93%. The services inflation excluding energy and rent is only 2.32%. Services inflation is related to the labor market because it is labor intensive. The lack of sharp wage growth gains means inflation will remain subdued.
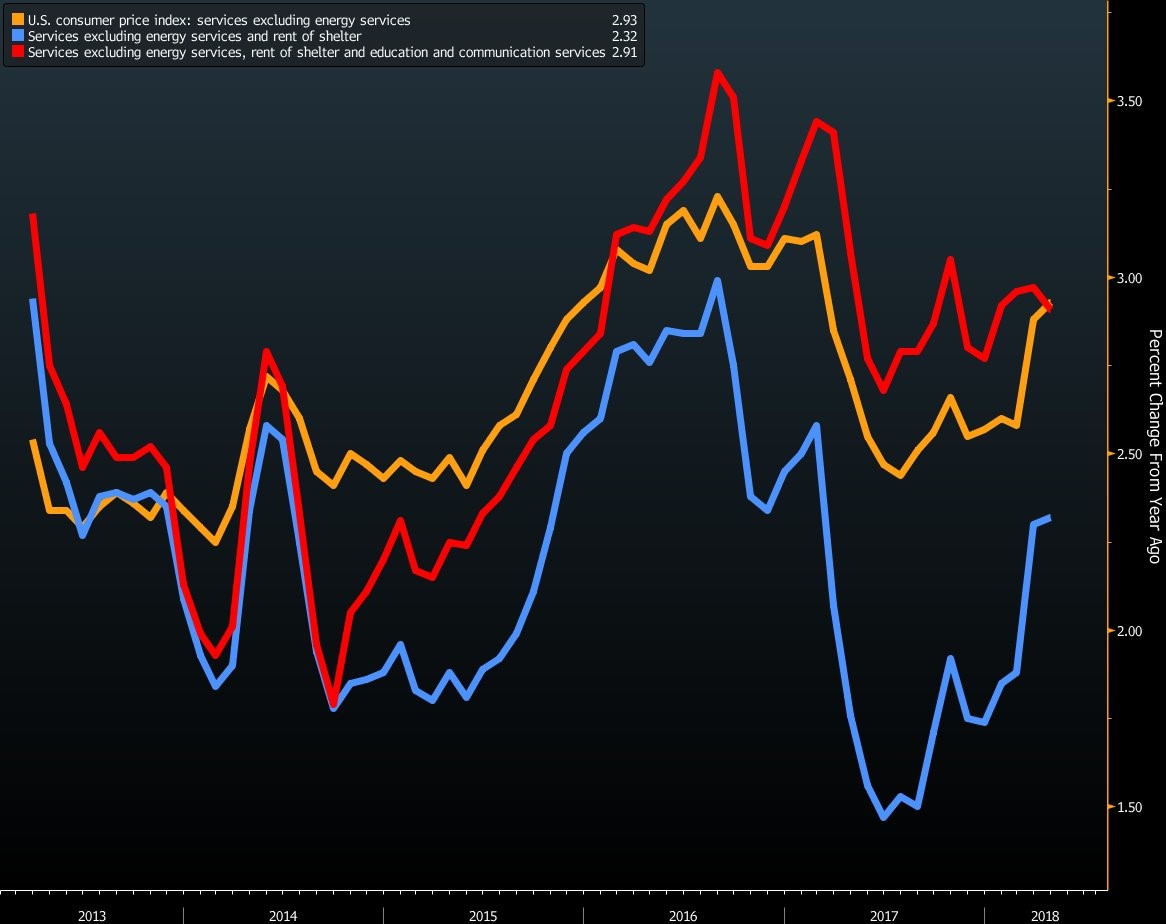
Source: Bloomberg
Price of physical goods are down and there has been a 3.9% decline in internet services. Yellen complaining about the weakness in wireless services prices in 2017 was silly because there’s always going to be a transitory change in a sub-component. Wherever technology is involved, generally prices fall. The Fed must rely on shelter inflation, which appears to be at highs, to drive core CPI significantly higher. We say it looks tapped out because the chart below shows both inflation rates peaked over a year ago.
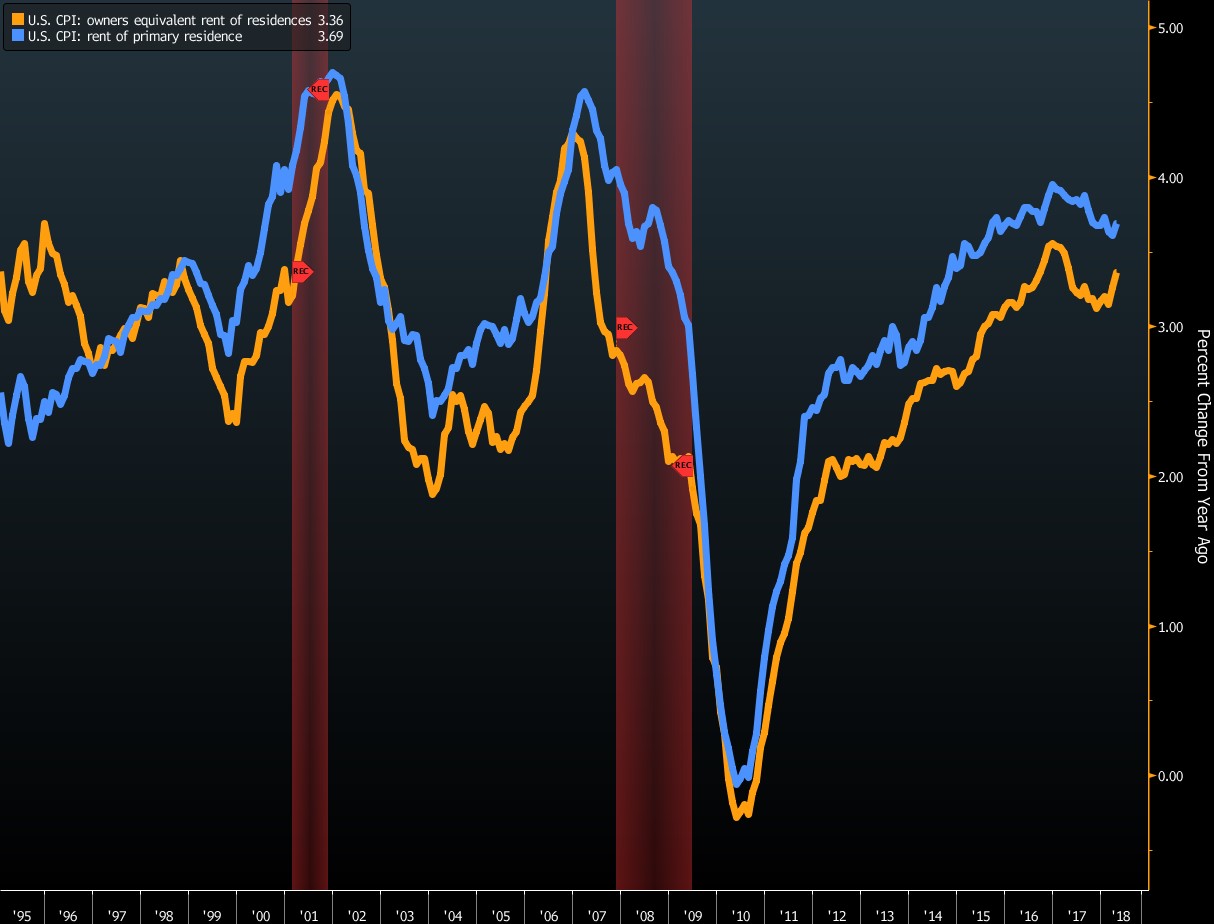
Source: Bloomberg
Conclusion
Stocks are enjoying this period of weaker than expected inflation as the Fed won’t need to increase the pace of rate hikes. We will keep the inflation data on our radar because if it does turn, stocks could become a victim. The media likes to express inflation weakness as a bad thing, but the reality is growth and inflation aren’t the same. The best situation would be great consumer spending and profit growth along with modest pricing pressure.
Here are a few additional articles on this topic:
- Gold vs Inflation: Not What You Expect
- Federal Reserve Dilemma Suggests Higher Inflation
- Is Price Inflation Falling?
- Price Inflation Distribution Is Not Uniform In US
- Why Inflation Will Increase In 2018
- Correlation/Causation with Interest Rates, Inflation, and Stocks
Have comments? Join the conversation on Twitter.
Disclaimer: The content on this site is for general informational and entertainment purposes only and should not be construed as financial advice. You agree that any decision you make will be based upon an independent investigation by a certified professional. Please read full disclaimer and privacy policy before reading any of our content.


