UPFINA's Mission: The pursuit of truth in finance and economics to form an unbiased view of current events in order to understand human action, its causes and effects. Read about us and our mission here.
Reading Time: 6 minutes
We’ve had some readers question the Fed’s use of CPI as a measurement of price inflation. The chart below might satiate them as it shows the eight components of CPI.
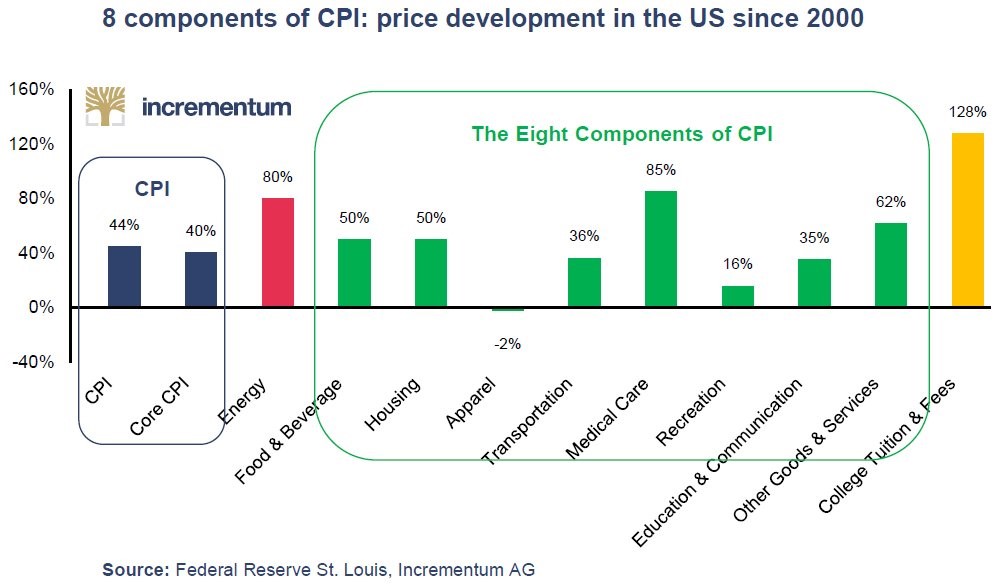
17 Year Inflation Breakdown
Medical costs have pushed inflation higher. Keep in mind, this is over a 17 year period. We’re not ignoring the recent acceleration in medical cost inflation. The media always draws attention to the increase in energy prices, medical costs, and college tuition because they are big stories. However, there aren’t as many reports on the segments which have seen below average price inflation such as recreation, apparel, education & communication, and transportation. Therefore, it seems like price inflation is higher than it is on everything. While this certainly doesn’t make it easier that there is price inflation, every sector needs to be reviewed individually.
As we’ve mentioned in a previous article, college costs are their worst in terms of price inflation. A decline in costs of tuition or a bursting of the student loan bubble would alleviate low economic growth. Now default rates are high, prices are high, and because so many people have a degree, it doesn’t differentiate workers at all. The price doesn’t match the product’s value.
Back To The Basics On Gold
Surprisingly, one of the most contentious issues about gold and inflation isn’t where they are headed; it’s their relationship. Traditionally, it’s thought that precious metals are inflation resilient. It’s not enough to say they are inflation hedges because they maintained their value over time. We’re not disputing gold’s ability to maintain its value in the future; we’re saying investors need more due diligence done before adding it to their portfolios. As we’ve detailed previously in Is Gold A Good Investment?, the relationship between gold and inflation in the short-term is complicated, because real interest rates, not nominal, are important to consider.
As you can see from the chart below, the 10 year Cleveland Fed expected inflation rate and the S&P GSCI precious metals total return index have an r of -0.08 meaning they are uncorrelated.
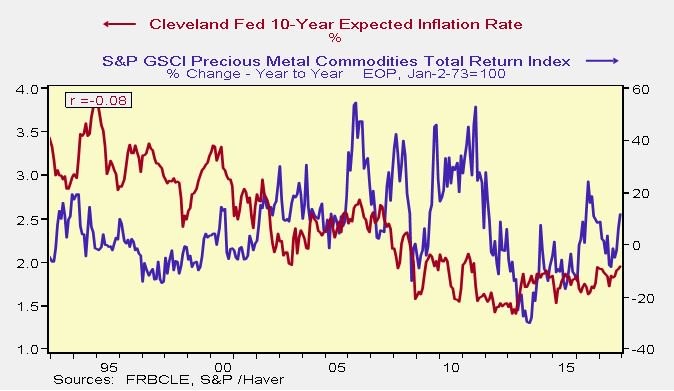
Precious Metals & Inflation Expectations Aren’t Correlated
Therefore, it’s arguable the ability to decipher charts is the most important skill investors need to hone. First off, there are chart crimes which need to be avoided. They can include charts with truncated axes, duel axes (when the numbers don’t add up) and when variables are considered as absolutes. It’s easy to make mistakes when analyzing the relationship of something, since a picture can say a thousand words, especially if its a misleading chart. Therefore, looking at all charts with skepticism is critical.
The chart below aims to show gold and TIPS (Treasury Inflation Protection Securities) have a consistent relationship, but it has a couple chart crimes. Firstly, the x axis has a very narrow range. Secondly, it doesn’t show which time period this is for. You can get an idea when this is from by looking at the price of gold, but it’s a bit ambiguous.
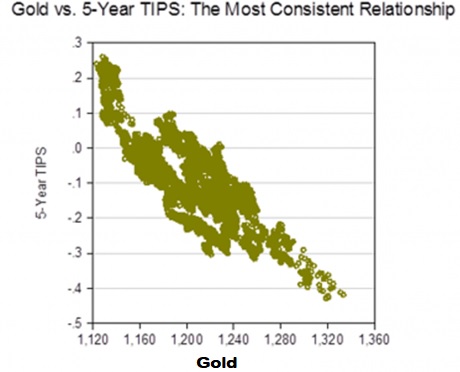
Gold & TIPS Are Correlated? #ChartCrime
The chart below is a better depiction of what the first TIPS and gold comparison aimed to show. As you can see, the price of gold and the TIPS price have tracked each other for the past 10 years.
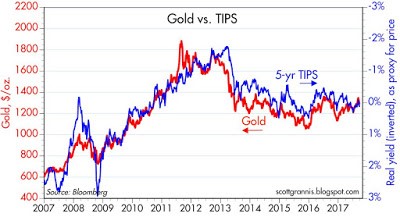
Gold Versus TIPS Over Only 10 Years
The implication is that real growth expectations and gold are related. Some gloss over this statement by simply saying TIPS and gold are both hedges against economic weakness, which explains why they are highly correlated. Some might even completely miss the mark by using this to support the notion that gold and inflation are correlated. However, that’s mixing up the breakeven inflation rate and the TIPS. The breakeven rate is the nominal treasury yield minus the TIPS yield.
Looking for the chart crimes, don’t be alarmed by the inverted right hand column because that’s allowing bond yields to be a proxy for price since as bond price goes up, yields fall. However, we’re always skeptical of two variables which have such a high correlation. There’s a big motivation for chart makers to force correlations to exist, unknowingly making them misleading. There is nothing fun about a chart that doesn’t show a correlation because it can’t predict anything. However, the financial world is filled with uncorrelated and slightly correlated assets. The one redeeming part about precious metals if they aren’t going to save you from inflation is they can be uncorrelated from your portfolio which improves its Sharpe ratio and long-term returns.
The chart below gives the full picture between the correlation of gold prices and 5 year TIPS.

Longer Term Correlation Between Real Gold & TIPS Doesn’t Hold Up
This chart shows more information as it goes back to 1977. The first gold vs TIPS chart above uses 10 years of data because it is almost all the observable information we have. The longer term chart however extrapolates where the TIPS would have traded at. The point is short term charts can be misleading. As you can see, the chart also uses real gold prices indexed to 1997. This improves the accuracy of the stat because nominal prices aren’t the same as real prices the further you go back in history. The conclusion from this chart is the 5 year TIPS and the real gold prices aren’t correlated.
If you want further clarification of the original chart which shows inflation expectations compared with precious metals, the chart below compares the 5 year breakeven rate with real gold prices.
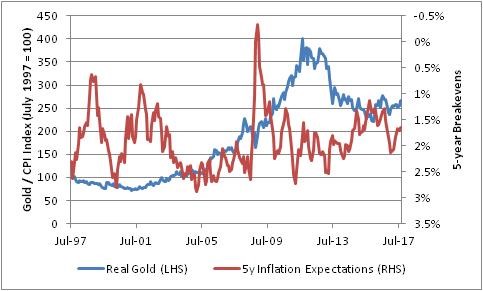
5 Year Breakeven (Inflation Expectations) & Real Gold Aren’t Correlated
As you can see, this chart shows inflation expectations and real gold prices aren’t correlated. If you think about this relationship mathematically, the inflation expectations can be thought of as the first derivative of inflation. We can compare inflation to gold prices, but most investors don’t think that’s valuable because you’re not getting in the heads of investors. When you look at the price of gold, you want to know why investors are buying and selling it. Expectations give you a picture of what investors are assuming at the moment even if it doesn’t end up being realized.
Getting back to the math analogy, you can take a second derivative of inflation expectations to get a different picture of this relationship. The second derivative of inflation for the first derivative of inflation expectations is the velocity of the change in inflation expectations. That chart is shown below as the weekly change in gold prices is compared to the weekly change in 10 year breakeven inflation. As you can see, those two variables have a low correlation.
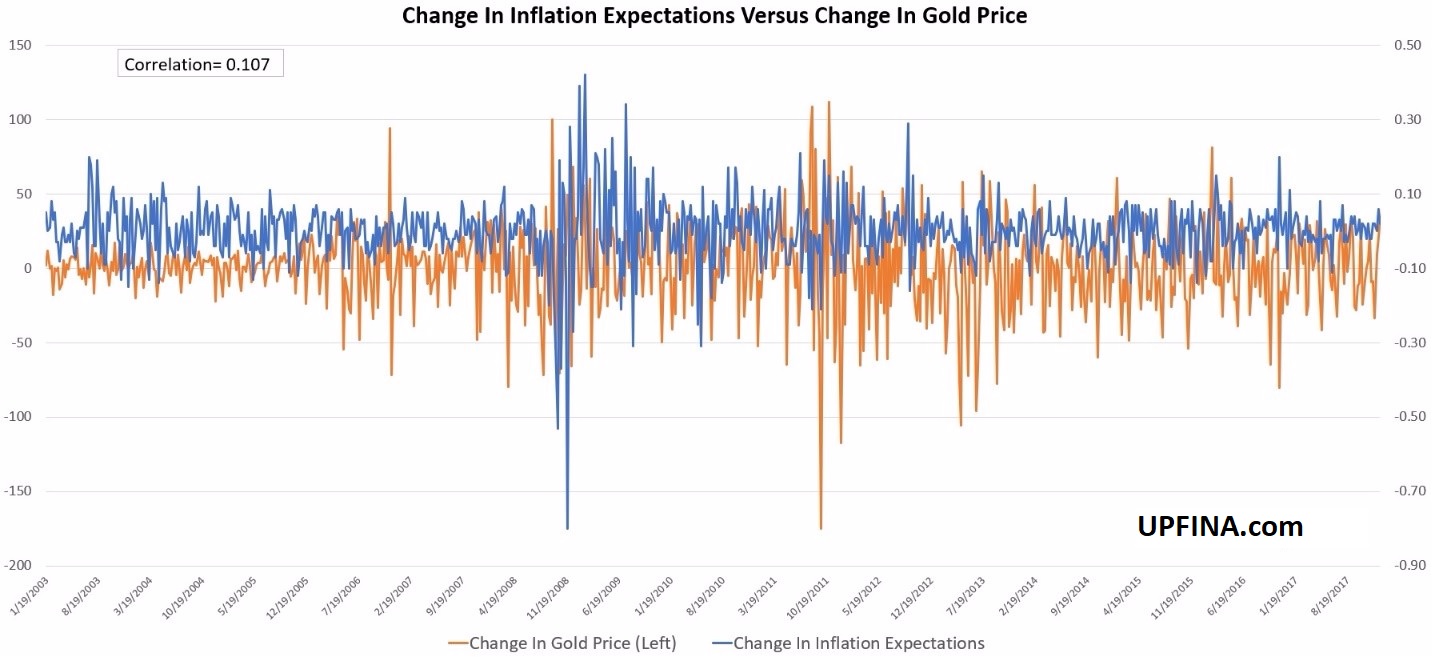
Change In Gold Prices & Change In Inflation Expectations Have A Low Correlation
Conclusion
We’ve established that the prices of goods which inflate the most get the bulk of the media coverage while stable prices don’t get noticed, which is why many think inflation must be higher than the CPI calculation. Furthermore, we showed how gold/precious metals and inflation aren’t correlated. We also showed an example of a chart crime with the conclusion that 5 year TIPS aren’t correlated to gold either. Finally, we showed how the velocity of changes in inflation expectations also aren’t correlated to gold price changes.
Have comments? Join the conversation on Twitter.
Disclaimer: The content on this site is for general informational and entertainment purposes only and should not be construed as financial advice. You agree that any decision you make will be based upon an independent investigation by a certified professional. Please read full disclaimer and privacy policy before reading any of our content.


