UPFINA's Mission: The pursuit of truth in finance and economics to form an unbiased view of current events in order to understand human action, its causes and effects. Read about us and our mission here.
Reading Time: 5 minutes
The top two stories in markets in September are the rally in U.S. stocks to record valuations versus the rest of the world according to price to book value and the sell off in long dated U.S. treasuries. Regardless of whether you follow the price to book value, US outperformance is a key theme of 2018. The sell off in treasuries changes how many view markets. We will review the cause and effect of this decline in this article.
Major Sell Off For The 10 Year Bond
As you can see from the chart below, the 10 year yield recently closed above 3% for 3 days in a row which is only the second such streak since July 2011.
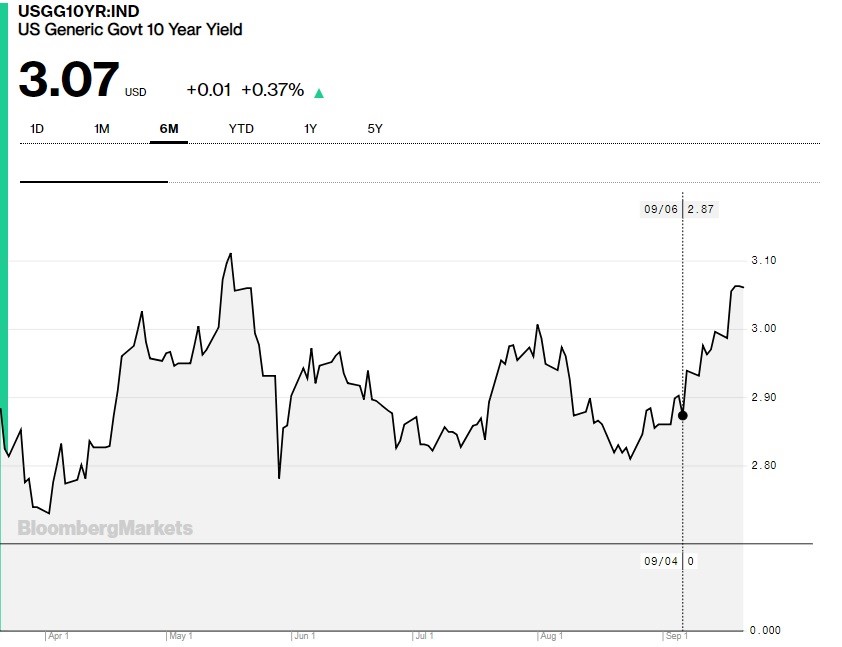
The 10 year yield had been range bound between 2.8% and 3% for a few months. As of the writing of this article, the 10 year yield hasn’t hit its 7 year high of 3.11%, but plus or minus a few basis points doesn’t affect any of the ideas expressed in this article.
Magic Number: 2.9% Hourly Wage Growth
This sell off in the 10 year bond is like déjà vu because there was a similar sell off in February after the BLS labor report initially showed January’s hourly wage growth was 2.9%. That wage growth was later revised to 2.77%, but the market didn’t know that revision would occur at the time. From February 1st, which was the day before the January labor report, until February 21st, the 10 year yield increased from 2.79% to 2.95%.
We can never know for sure why investors were selling the 10 year treasury, but that was the top reason given by the financial press. Hard data on nominal wage growth is important because it signals nominal economic growth will increase. Wage inflation should occur. Real wage growth can also boost real consumption and in turn real GDP growth if inflation doesn’t rise as quickly as wage growth.
We say the situation is déjà vu because the August hourly wage growth was 2.91% which is the highest hourly wage growth since the expansion started. It’s no surprise that increased wage growth caused the 10 year yield to increase. The expectations were for 2.8% growth, meaning it beat by 0.1%. In the previously discussed January labor report, the expectations were for only 2.6% growth, so this August report came as less of a shock to the market. Either way, it’s still strong growth that begets higher yields.
As highlighted in the chart above, the 10 year yield was at 2.87% the day before the August labor report which was released on the first Friday in September. As of the morning of September 21st, it traded 20 basis points higher at 3.07%. This increase is a bit more than the one in February. The September sell off in treasuries occurred with a rally in stocks while the February increase occurred with a correction in stocks.
3% Yield Not Causing A Sell Off In Stocks
Some investors blamed the 10 year yield increase for the early 2018 correction. We suggested in our articles that higher yields wouldn’t beget lower stock prices. Not to rehash arguments, but someone willing to take low risk in long term treasury bonds isn’t the same type of investor buying stocks. Sectors like consumer staples, utilities, and telecom can be close to bonds, but the largest stocks are tech giants with low yields, so the point stands.
Breakeven Inflation Versus Real Yields
Nominal yields are real yields plus breakeven yields. The breakeven rate gives you a market based view of inflation. Don’t make the mistake of viewing the breakeven rate as some sort of absolute truth. It can be mistakenly priced just like the stock market can be priced incorrectly. The chart below shows the breakeven inflation rate has increased from 2% on January 2nd to 2.15% as of September 19th. This shows there has been an increase in inflation expectations.
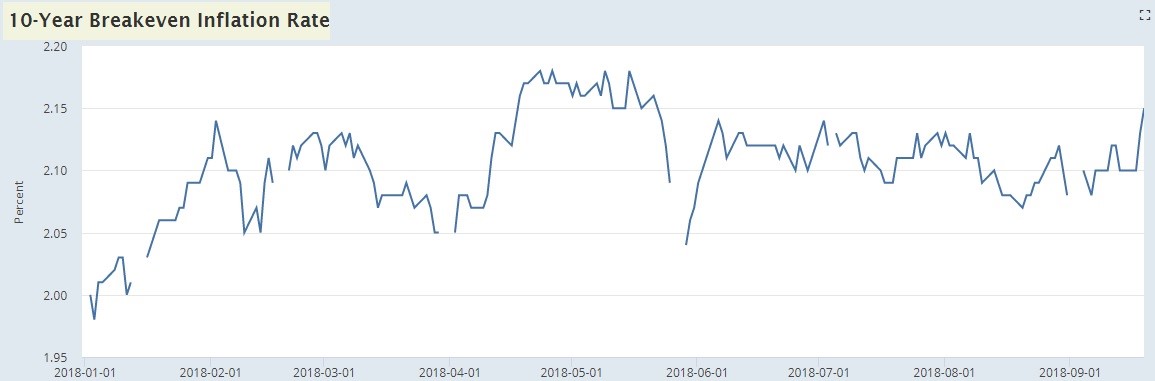
From September 6th to September 19th, the inflation expectations increased 7 basis points from 2.08% to 2.15%. This is the highest breakeven rate since May 2018. If it gets above 2.18%, it will be the highest since August 2014. The increase in nominal yields has partially been caused by the increase in inflation expectations.
The chart below shows the 10 year real yield.
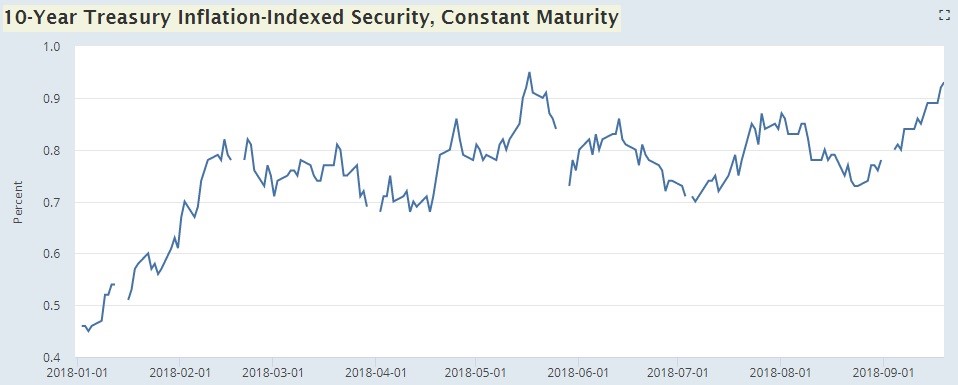
The 10 year real yield increased from 0.46% to 0.93% from January 2nd to September 19th. That’s a bigger increase than the breakeven rate possibly because of increased real growth expectations. From September 6th to September 19th, the real yield increased 13 basis points from 0.80% to 0.93%. Growth expectations are high as this is the highest yield since May 2018. If it gets above 0.95%, it will be the highest rate since March 2011.
Yield Curve Steepens
One interesting part of this rise in the 10 year treasury yield is the steepening in the yield curve. The 2 year yield hasn’t increased as much as the 10 year yield, signaling the expectations for rate hikes haven’t increased as much as the long bond yield. That’s not to suggest that expectations for rate hikes haven’t been increasing, because they have.
The chart below shows the difference between the 10 year yield and the 2 year yield bottomed at 18 basis points. It’s now at 26 basis points.

The rising 10 year yield allows the Fed to raise rates further without an inversion. Pushing away an inversion implies the next recession will be further in the future. The curve can invert if expectations change or it can stay normal for a few quarters. You shouldn’t expect an inversion on the sole basis that it’s close to occurring. This means you can’t expect a recession just by extrapolating the trend in the curve.
Fed Dots Versus Futures
With the increased expectations for rate hikes, the Fed funds futures are closing in on the Fed dot plot. As you can see from the chart below, the futures market expects the Fed funds rate to be 2.83% by the end of 2019 and the Fed dot plot shows the Fed expects it to be 3.13%.

Conclusion
There’s more to changes in rates than just one number in the labor report, but the previous and current reaction in the treasury market suggests the spike in hourly wage growth was a big reason why the 10 year yield increased recently. Since it’s already up 20 basis points, the yield might stabilize, but it can increase further if the September BLS report shows strong hourly wage growth.
Have comments? Join the conversation on Twitter.
Disclaimer: The content on this site is for general informational and entertainment purposes only and should not be construed as financial advice. You agree that any decision you make will be based upon an independent investigation by a certified professional. Please read full disclaimer and privacy policy before reading any of our content.


