UPFINA's Mission: The pursuit of truth in finance and economics to form an unbiased view of current events in order to understand human action, its causes and effects. Read about us and our mission here.
Reading Time: 5 minutes
The way you interpret the economic data released in the PCE and ECI reports depends on if you fear inflation or an economic slowdown more. It’s not an easy decision to make because on the one hand, the labor market is tightening and the cycle is probably near its end. That means you expect inflation to increase, which is generally the case at the end of the business cycle, which eventually causes rate hikes and then a recession. Since you expect inflation to pick up, you would want to see inflation miss estimates, to delay the next recession. On the other hand, if you fear a slowdown, then you fear weakness in economic growth and inflation. There has never been sustained core PCE price inflation of 2% this cycle which may mean some economists are willing to overlook inflation and always hoping for more inflation and growth. It’s fair to say that beauty is in the eye of the beholder. An interesting addition to that point is even if you are worried about the economy overheating, if you see sharp weakness, you’ll realize you were wrong and begin to fear a recession. If you see economic strength and inflation when you expect a slowdown, you’ll switch towards fearing inflation.
Inflation Falling
The June PCE price index was up 0.1% month over month and 2.2% year over year. The month over month data met estimates and the year over year report missed them by one tenth. The May year over year inflation was revised from 2.3% to 2.2%. This report showed slight weakness, so most economists won’t be changing their predictions based off it. As you can see in the FRED chart below, core PCE was up 1.9% year over year and May’s report was revised lower from 2.0% to 1.9%, both below the Fed’s 2% goal.
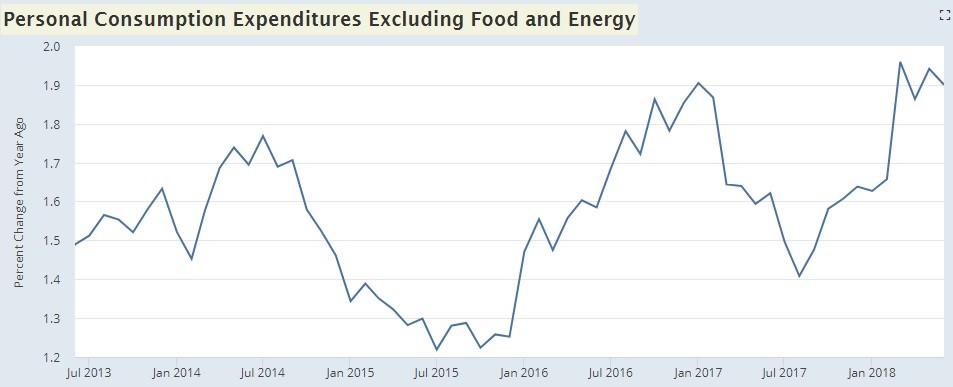
Source: FRED
June’s report missed estimates by one tenth. Month over month inflation was 0.1% which missed estimates by one tenth. The rate has now been below the Fed’s target for the past 3 months. Since you need to round up to get to the 2% rate in April, technically it hasn’t hit the Fed’s target since April 2012. Inflation has only been above 2% for 5 months in this entire expansion. It’s possible to expect inflation to stay below 2% while the economy keeps growing. Weak productivity growth and slack in the labor market have prevented nominal wages from growing as quickly as they did in prior expansions. This nominal wage growth usually spurs inflation, thus subduing real wage growth.
Decent Income & Spending Growth
We were interested to see the consumer spending and personal income growth because the ECRI used its weakness in their negative thesis on the economy. We already knew the consumer was in solid shape because the Q2 GDP report showed real consumption grew 4%. Since the economy is driven by the consumer, that is great news. Personal income and consumption growth were solid in the June PCE report.
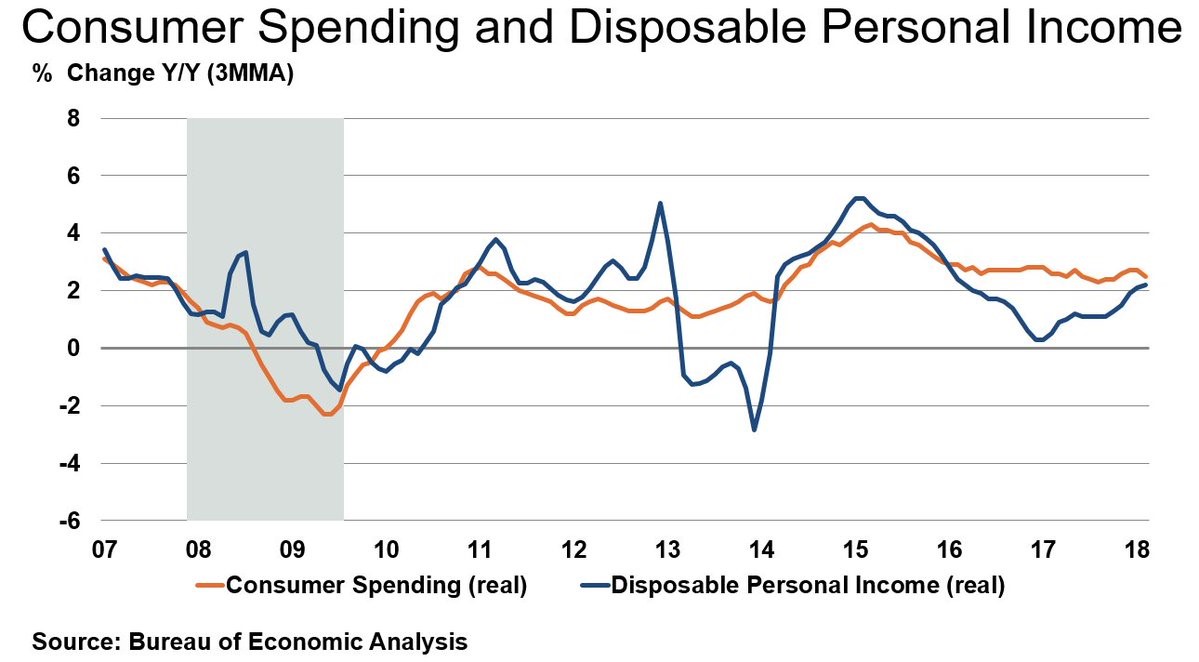
Source: Bureau Of Economic Analysis
Personal income growth was 0.4% month over month which was the same as May and met estimates. You can see in the chart below, the year over year increase in disposable personal income was 3.1%. The year over year real personal income growth was 2.6% which was up from 2.3% in May. Real consumer spending was up 0.4% month over month. May growth was revised from 0.2% to 0.5%. It was up 2.8% year over year. These changes in income and spending led the savings rate to remain flat at 6.8%. The savings rate increased this cycle because of the revision. There’s no reason to worry about economic growth based on these reports. The latest NY Fed Nowcast expects 2.83% growth which is solid because the NY Fed expected 2.78% growth in Q2 and it came in at 4.1%.
Employment Cost Index
The employment cost index tells us how quickly wages and salaries grew as well as benefits. It’s important to follow growth in benefits to get a complete picture of the compensation workers are receiving. The Q2 report saw 0.6% quarter over quarter growth in the ECI index which missed estimates for 0.7% growth and was 2 tenths below the Q1 report. The year over year change was 2.8% which was above Q1’s growth of 2.7%. The chart below breaks down the change.
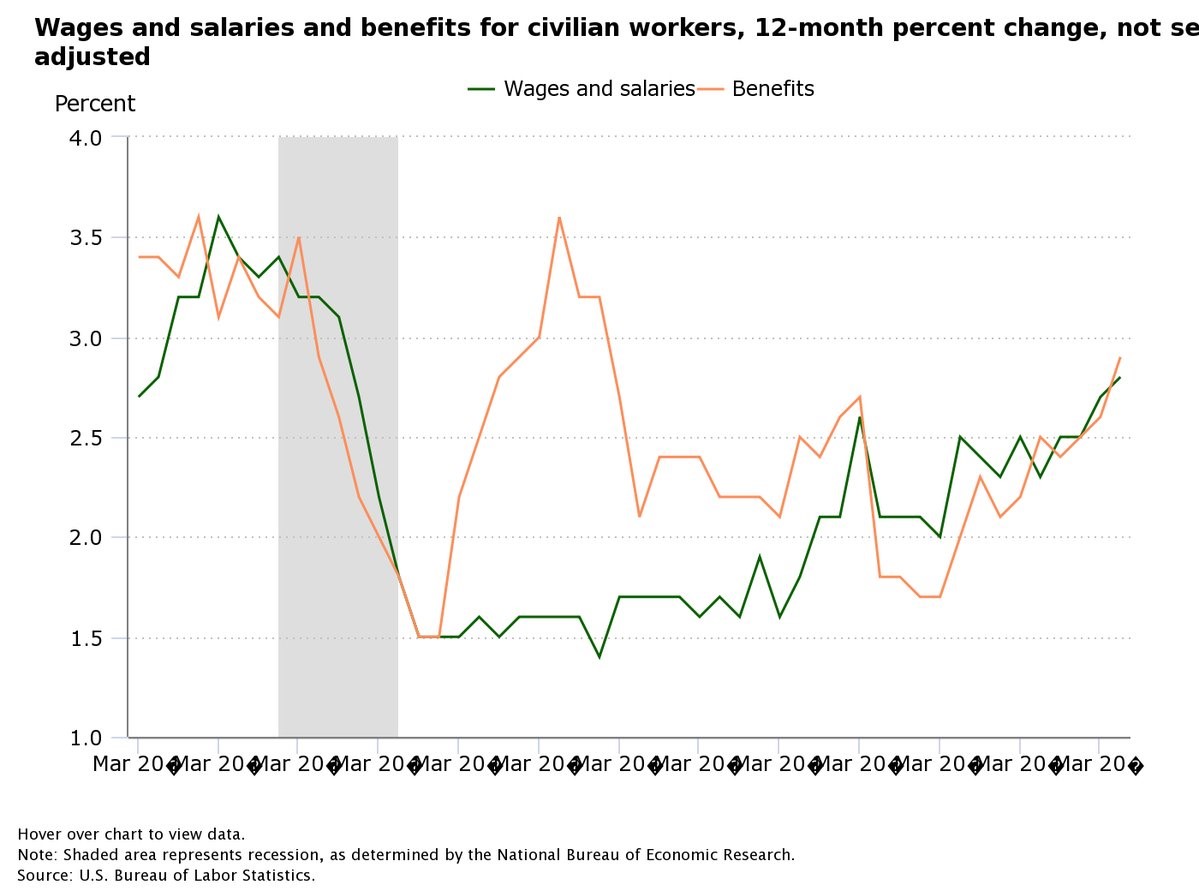
Source: U.S. Bureau Of Labor Statistics
Wages and salaries were up 2.8% and benefits were up 2.9%. Both are signaling the labor market is improving, but it’s likely not full because the growth is below what was seen last cycle.
Fed Policy
If the Fed were to follow the ECRI leading index, it would stop hiking rates for at least 6 months to see how quickly the economy slows. If the Fed decided to only listen to the yield curve, it would end its hike cycle after one or two more hikes because the difference between the 10 year and the 2 year yield is 32 basis points. The Fed isn’t focused on the ECRI leading index and doesn’t set policy according to the yield curve. It looks at inflation and economic growth. After the tepid June core PCE report, it’s fair to wonder why the Fed is prepared to hike rates so quickly and when the hike cycle will end.
The Bloomberg chart below shows the chances of a Fed rate hike at each meeting until June 2019.
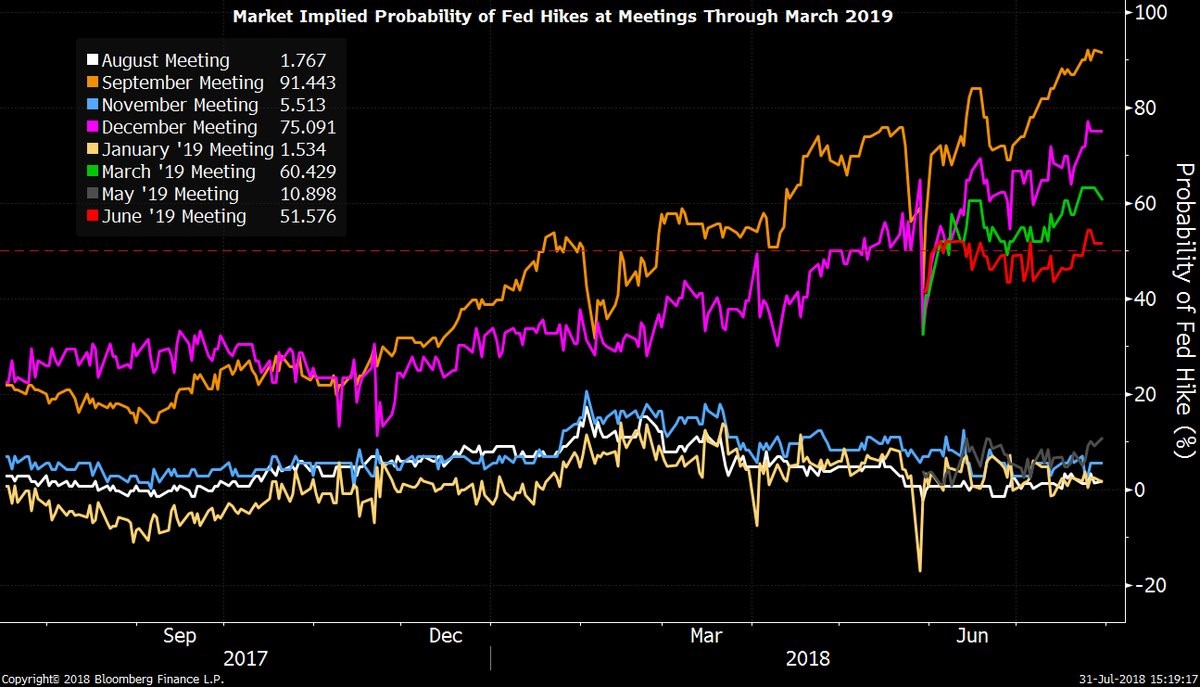
Source: Bloomberg Terminal
The Fed didn’t hike rates at the recent August meeting, but there is the potential for there to be 4 more hikes in the next 12 months. That could easily push the Fed funds rate above the natural rate, meaning monetary policy will be contractionary.
Healthcare Costs
It’s fair to say the core PCE price index is designed to show low inflation because it ignores food and energy. The rate almost always come in below the core CPI as well. The WSJ chart below shows the change in the consumer price index compared with the change in medical care costs from 1960 to 2017.
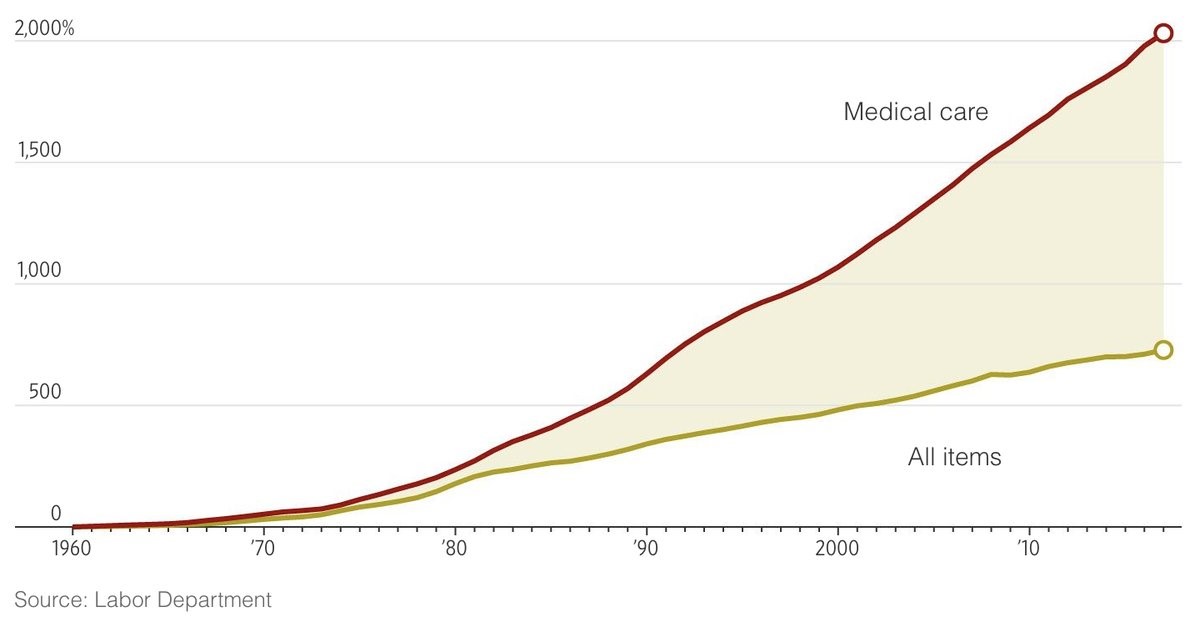
Source: Wall Street Journal
As you can see, medical care prices have exploded higher. America is soon going to spend 20% of its GDP on healthcare.
Conclusion
The economy is in good shape because the consumer has deleveraged, and solid economic growth is occurring with inflation staying below the Fed’s 2% target. The reports reviewed in this article show us the economy is ‘status quo’ which means risk assets can move higher.
Have comments? Join the conversation on Twitter.
Disclaimer: The content on this site is for general informational and entertainment purposes only and should not be construed as financial advice. You agree that any decision you make will be based upon an independent investigation by a certified professional. Please read full disclaimer and privacy policy before reading any of our content.


