UPFINA's Mission: The pursuit of truth in finance and economics to form an unbiased view of current events in order to understand human action, its causes and effects. Read about us and our mission here.
Reading Time: 5 minutes
The American worker is getting fleeced. This has been happening for decades, but in recent years the problem has intensified with current monetary policy and lack of fiscal reform. However, the recent gradual change in monetary policy may provide a light at the end of the tunnel. The only question that remains is if that light is an oncoming train or wage growth.
The chart below shows how the recent economic recovery hasn’t met the Fed’s target of achieving about 3.5% hourly earnings growth per year.
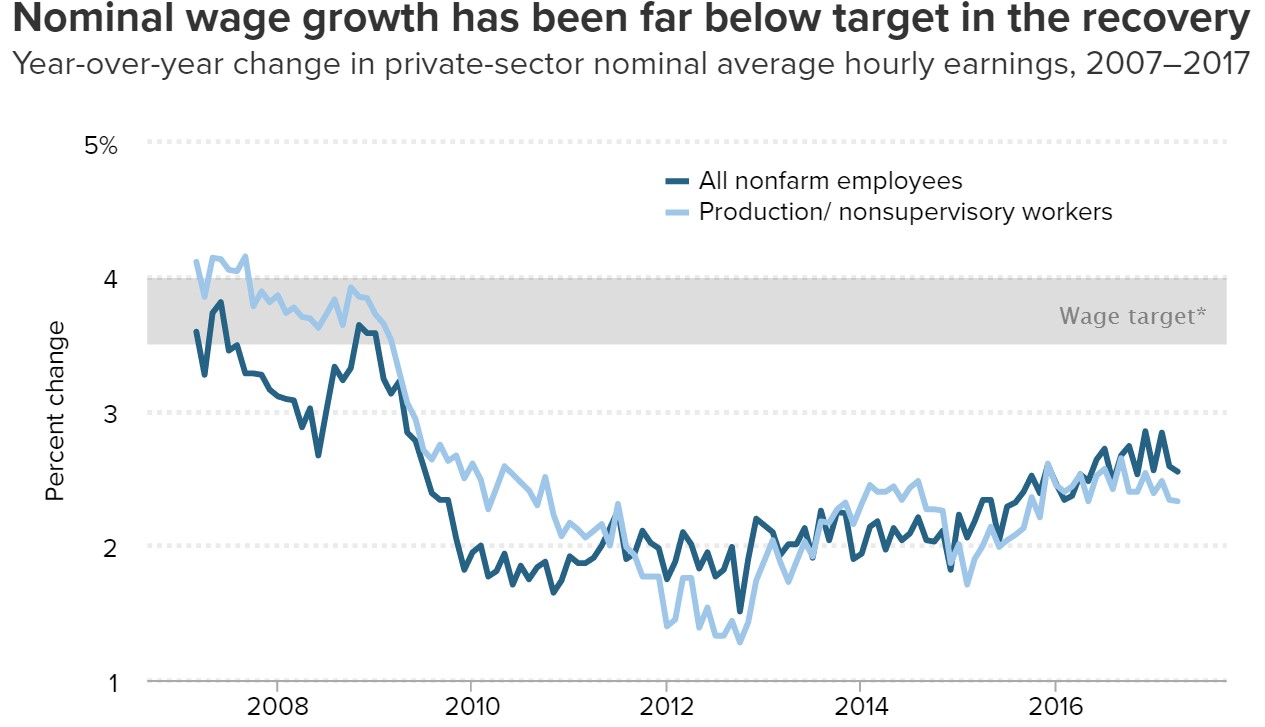
Almost the entire recovery has been below the target. The blue line shows all workers and the light blue line shows nonsupervisory workers. This separates out the non-management workers to see the distribution of wage gains. Lately, the workers at the bottom rung of the employment ladder have been seeing wages grow slower than managers.
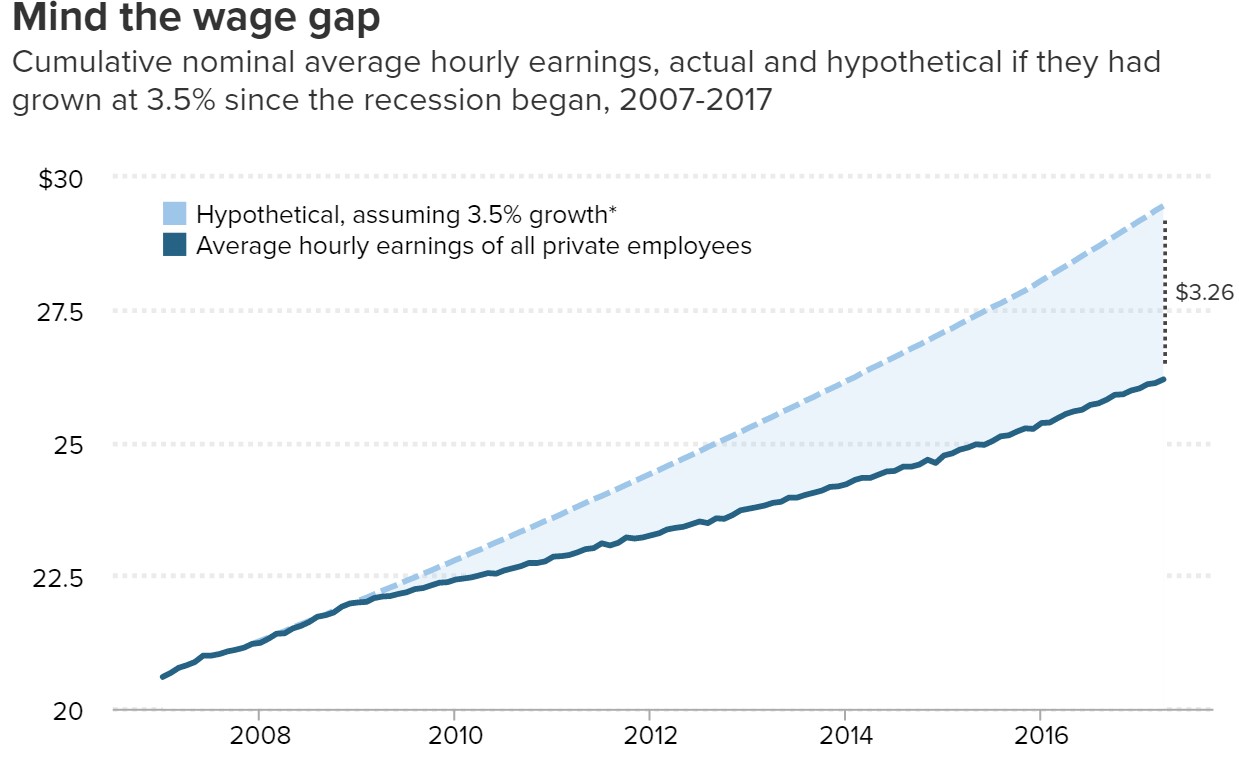
It’s important to recognize that every year that wage growth is below the Fed’s goal, the problem compounds itself. In theory, to satisfy the terrible recovery, growth would need to exceed the Fed’s goal to make up for the lost income. The chart below shows the growth of the income gap over time. If income growth were to make up the gap between actual results and the goal growth rate of 3.5%, workers would need to earn an extra $3.26 trillion dollars. That’s the wage deficit which is stifling economic growth because consumer spending drives 2/3rds of economic growth. The consumer can’t increase spending if income growth sometimes doesn’t even beat inflation.
The problem with wage growth is both cyclical and secular. Cyclical means in relation to the business cycle. In this case, it means that because this recovery has been weak, wage growth hasn’t been robust. Secular means it’s a long-term trend. In this case, it means there are structural factors at work which are preventing growth from ever achieving the Fed’s goals.
The chart below makes the case that the problem is cyclical. It shows the workers’ share of corporate income. As you can see, the share of income is in the mid-70s.

It has recovered to the low 80s in prior recoveries. The chart is slightly deceiving because the temporary large blip higher in the middle of the last recession was caused by a crash in corporate profits. While the workers got a larger percentage of the profits, they still lost out because profits fell. One of the reasons for why this recovery has been weak is because businesses weren’t allowed to fail in the last recession. When the free market works, the bad businesses fail and the new ones which are stronger, take over in the next recovery. By bailing out the automakers and the banks, the government propped up zombie-like businesses which were poorly run.
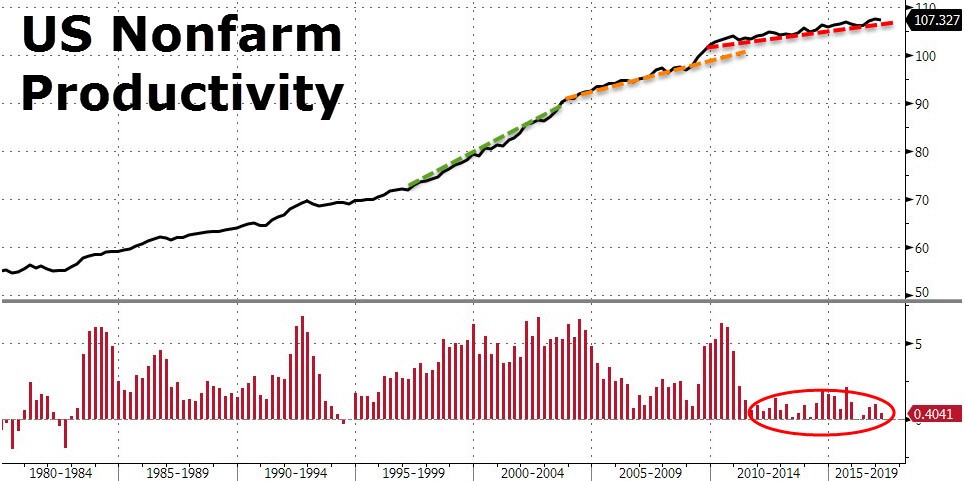
One of the reasons why we’ve seen wage growth stagnate in the latest two recoveries is because of stagnating worker productivity growth. Businesses can’t pay workers more if they aren’t producing more. The total cost of a worker is called unit cost. It relates the combined productivity growth with hourly earnings growth to come up with a total cost. If production growth is growing, unit labor cost will be lower than wage growth. In Q1 2017, wage productivity declined 0.6%. This meant the unit labor cost growth was 3.0% as hourly wage growth was 2.4%. The cost to employ workers went up more than wages because workers became less efficient.
The chart below shows the latest trend productivity growth. It lines up perfectly with the chart above. There was a slowdown during the early 2000s recovery and almost a complete halt in the latest recovery.
One of the reasons for the lack of productivity gains is the lack of business investment. The chart below shows the gross private domestic investment as a percentage of GDP.
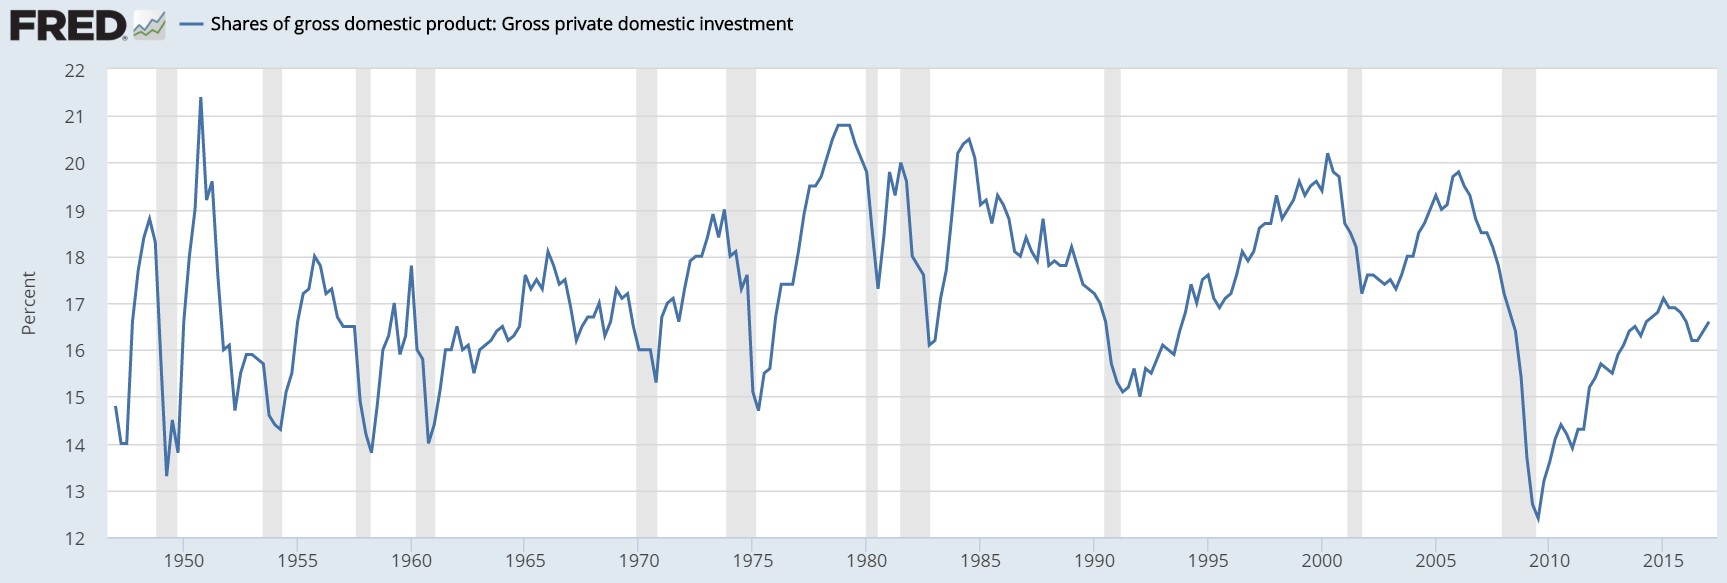
The latest recovery has seen much lower investment than the prior ones. Money is not flowing to capex where new innovations can be discovered which will boost efficiency.
This money that usually goes to capital expenditures to fund new projects went to buybacks and dividends instead as you can see in the chart below.
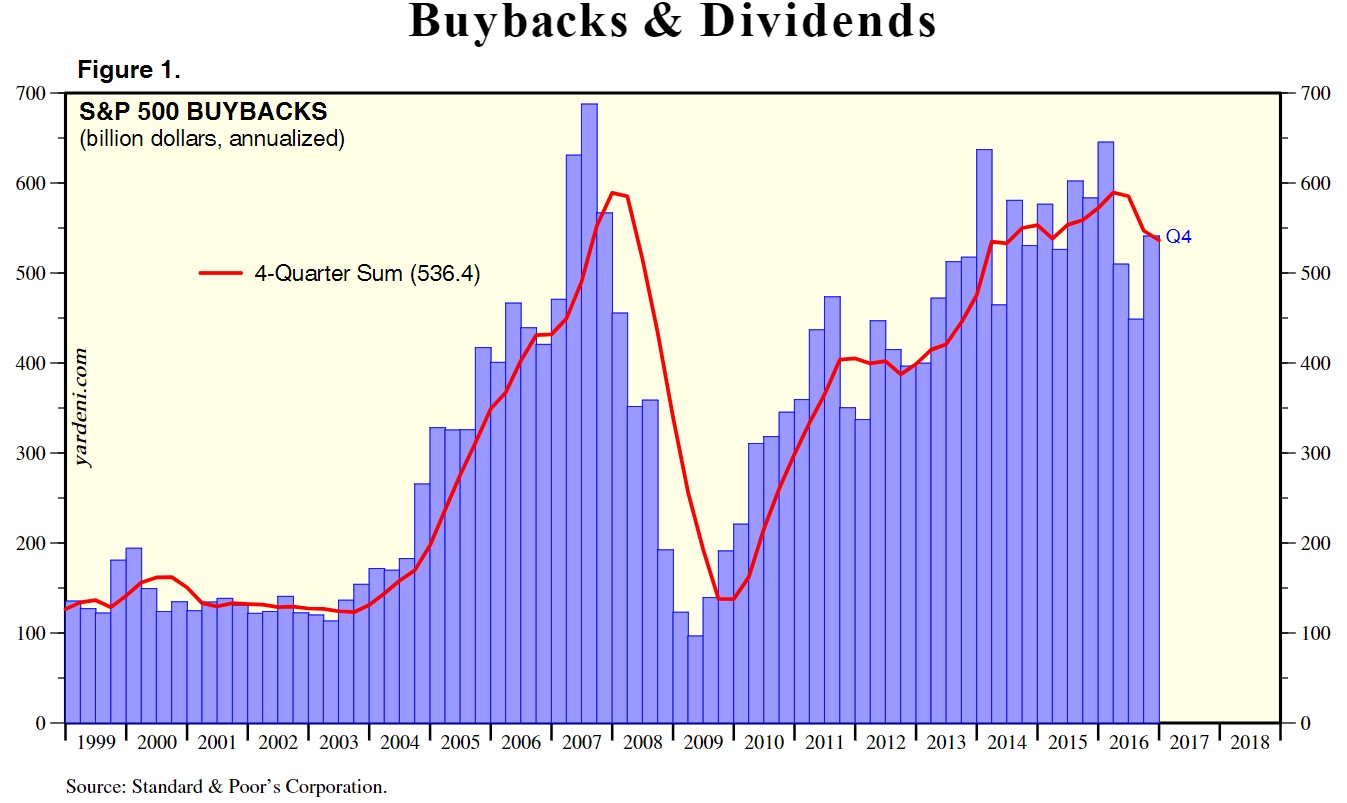
The economy has become financialized. With the adoption of 401Ks as retirement vehicles, baby boomers have piled into stocks. Firms have decided that they want to boost their short-term performance to get this money, so they boosted share repurchases and dividends. While this appeases investors, it hurts the economy because nothing new is created with the money spent on these activities. Even worse than that is the expansion in M&A activity as giant firms acquire fast growing small businesses and fire their employees in the name of cost cutting.
The chart below shows the compensation of employees as a percentage of GDP.
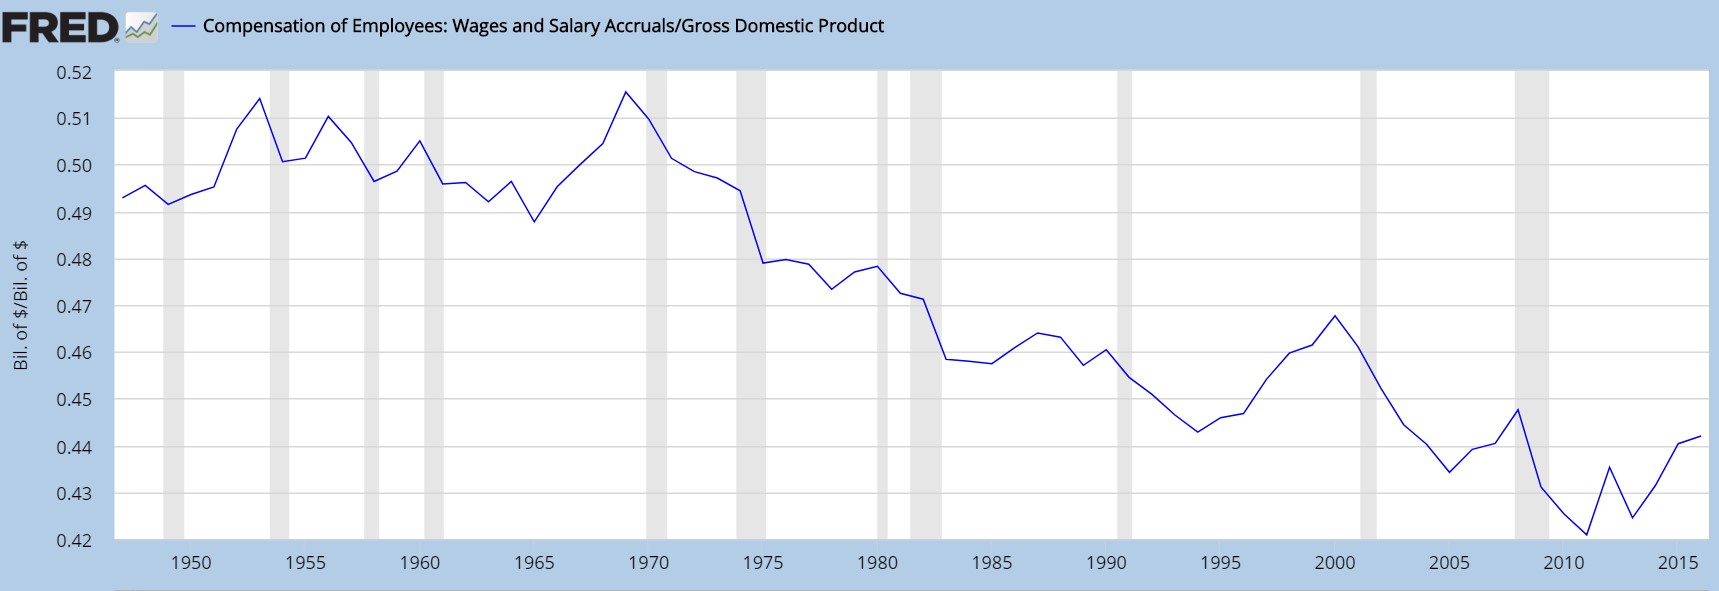
This is showing a longer-term secular decline in compensation. This percentage peaked in 1969 at 51.5% and bottomed in 2011 at 42.1%. This may be a long-term driver of the growth in the multiples of stocks and corporate profits as a percentage of GDP. For much of this decline, workers probably were satisfied because their wage growth was fine. Now that wage growth is stagnating, the workers are rising up and electing populist politicians to deal with this issue.
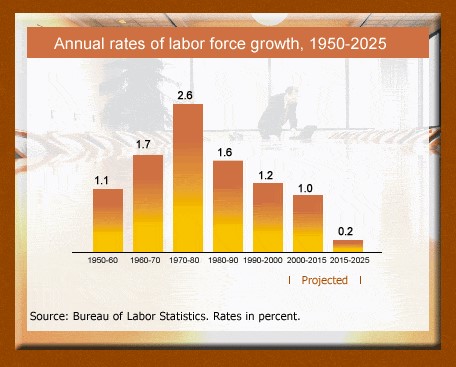
One of the catalysts for the increase of debt in the economy is the decline in the labor force population growth rate. As you can see in the chart below, the labor force growth rate from 2015-2025 is expected to be only 0.2%. The economy is juiced up on cheap debt to keep the merry go round going, but that comes at a cost as increased leverage makes economic contractions worse. Public firms have a tough time growing profits when the population growth slows which is why they artificially boost their earnings per share metrics with buybacks which give the appearance that the business is fine even though it’s long-term prospects become more challenged. The population is also aging which means health care costs will take up more disposable income. That money goes to the black hole that is the US healthcare system as inefficiencies are abound as the free market has been shirked for a corporatist structure.
Conclusion
Nothing lasts for ever. Systems and processes that are unsustainable will not last indefinitely. This applies to wages, capital investment and labor productivity. As financial engineering becomes less prevalent in this part of the cycle with central banks planning to reduce their balance sheets in an increasing manner starting in 2018, this will force companies to invest into their future, namely, workers and machinery. There is a light at the end of the tunnel, the only question is if another recession will happen before wages begin increasing or whether a decline in risk assets like stocks will bring about a gradual wave of change. But even then, as we reviewed previously, if a serious decline occurs in stocks and bonds, that could force an economic recession in itself.
Have comments? Join the conversation on Twitter.
Disclaimer: The content on this site is for general informational and entertainment purposes only and should not be construed as financial advice. You agree that any decision you make will be based upon an independent investigation by a certified professional. Please read full disclaimer and privacy policy before reading any of our content.


