UPFINA's Mission: The pursuit of truth in finance and economics to form an unbiased view of current events in order to understand human action, its causes and effects. Read about us and our mission here.
Reading Time: 5 minutes
The previous financial crisis was a disaster for many, with housing prices and equities falling precipitously. Since then, there’s been a new crop of ‘forecasters’ who have made a living explaining when the next crisis will be. That’s backwards looking analysis which feeds off people being scared and uninformed. Even after 8 years of a bull market, some of these doom and gloom soothsayers are still coming up with reasons why the market is about to fall off a cliff in the next few months. The 30th anniversary of 1987 stock market crash gave them fodder for their explanations. If an anniversary is part of an analytical viewpoint of the stock market, it’s safe to say rigorous due diligence isn’t being employed.
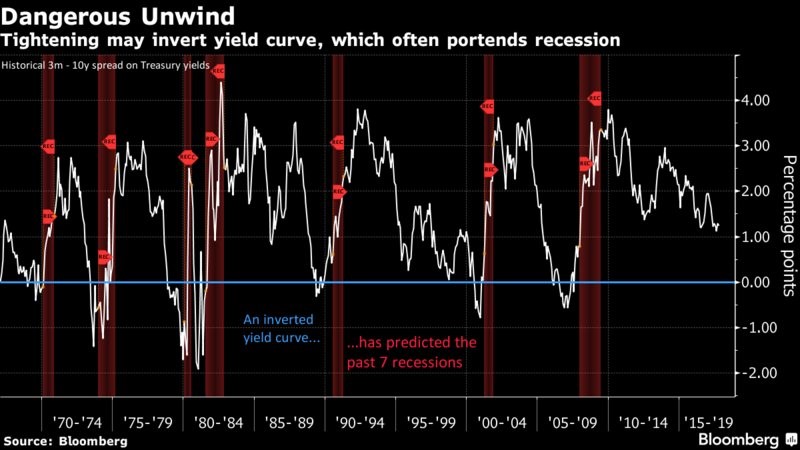
The most important indicator to look at is the yield curve. An inverted yield curve is when bonds with near term maturity dates have higher yields than bonds with long term maturity dates. As you can see from the chart below, an inverted yield curve has predicted the past 7 recessions.
Not many indicators have that great of a track record. With the economy looking weak in 2016, with central banks joining forces to prevent a recession, the one indicator which exuded calmness was the yield curve as it wasn’t close to being inverted. Recently, the yield curve has been flattening. Most spreads have the yield curve the flattest since the before the financial crisis. Don’t be alarmed by doom and gloomers claiming this flatness means a recession is coming. The recession usually comes after the inversion ends meaning we’re a few years away from a recession unless something shocking happens such as the Fed raising rates more than the market anticipates next year or core inflation finally explodes to 4%.
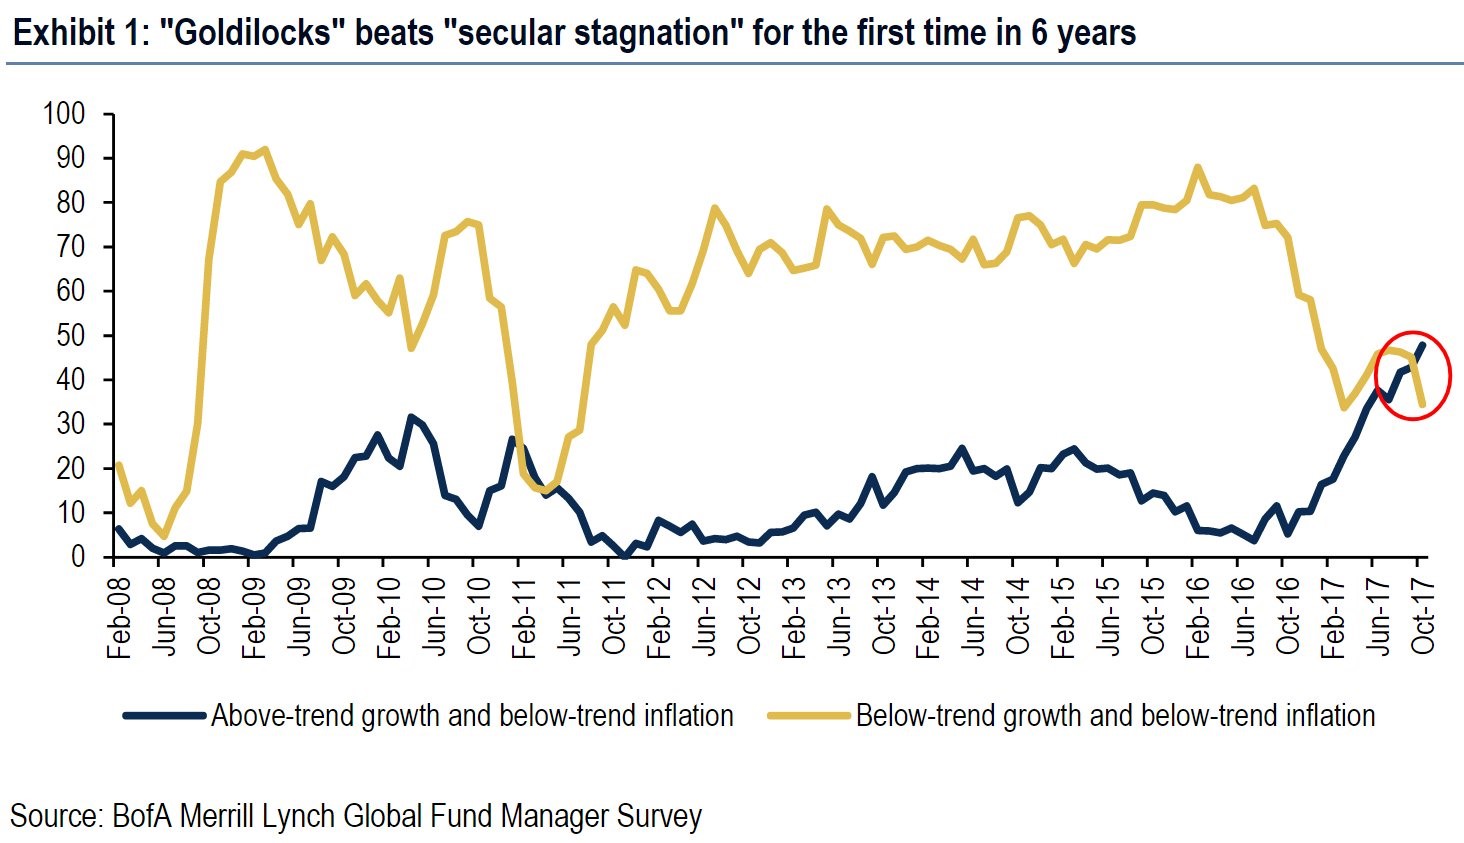
In a few articles, we’ve referenced the concept that this is a Goldilocks environment. The story of Goldilocks and the 3 bears is that one porridge was too hot, one porridge was too cold, and one was the right temperature. In this case, being too hot would be too much inflation, being too cold would be not enough growth, and the right temperature would be low inflation and high growth. This environment is approaching that level as 2017 appears to have accelerated growth from 2016 and inflation remains low. This environment means stock multiples can expand. Lots of analyses on equities assumes that multiples always revert to the mean. While at some point, the Shiller PE will move lower, it has been high for years. Explaining why that’s the case can help you make money in the medium term as others are waiting for long term valuations to normalize and are missing the rally.
The chart below is a survey done by Bank of America Merrill Lynch where it asks fund managers if the economy is in a Goldilocks scenario or a secular stagnation (low growth and low inflation). For the first time in 6 years we’re seeing the Goldilocks results win out over the stagnation results.
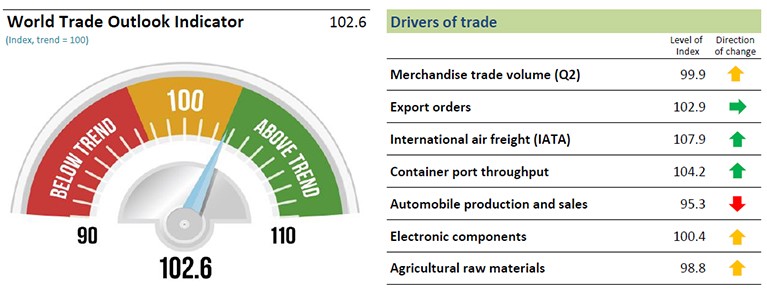
It’s amazing to see how stocks have rallied in such a poor environment. For the first time this cycle, a traditionally great scenario is about to emerge. This new Goldilocks scenario is catalyzed by the improvement in global trade and the ending of the commodities rout which had pushed the high yield spread higher and S&P 500 earnings growth into the negatives. For more information on the improvement in global trade, you can look at the WTO outlook indicator below. Only the automobile production and sales indicator is weakening. There was a temporary bounce in U.S. sales in September because many cars were destroyed by hurricanes Irma and Harvey. If that robustness continues, the indicator could head further into the above trend category.
One of the biggest arguments the bears make is there are debt bubbles in everything. Sometimes these bubble predictors fail to mention the improvement in assets which counteract the debt gains. Not all debt is bad. Apple takes out debt to fund its buyback which can’t be funded with cash overseas without paying the high U.S. corporate tax rate. Other smaller companies issue debt to grow their businesses.
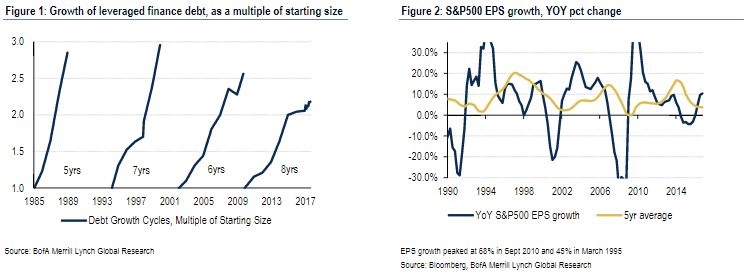
Getting more detailed into the corporate leverage issue, the chart on the left compares the past few cycles’ leverage growth as a multiple from the start of the cycle.
The current leverage growth hasn’t reached any of the prior cycle peaks. The stalling you see at the end of the line is from the corporate bond market weakness related to the energy collapse in 2015 to 2016. Because the dip in oil prices caused the high yield spread to spike, the debt issuance slowed for all companies. This weakness may have delayed the next recession by a couple years. As you can see, the other cycles ended quicker than this one. The length of the cycle is less important than the amount of leverage taken out.
The chart on the right shows the changes in S&P earnings. The 5 year average growth rate came close to the levels seen during the prior recessions mainly because of weakness in energy. Switching from a gain to a loss can have such an effect. With the positive results in the first half of 2017, it looks like another increase in the 5 year average is afoot. This makes a recession look further out in the distance. There will be a hiccup in Q3, but that’s temporary weakness caused by the hurricanes.
Conclusion
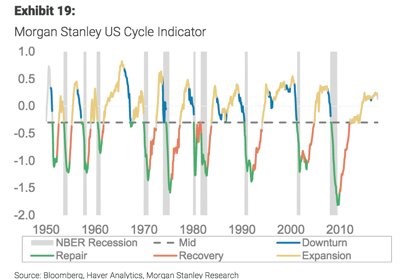
There aren’t many indicators which suggest a recession is coming in the next 12 months. In fact, there are a few indicators which show a re-acceleration in economic growth. The chart below shows the Morgan Stanley Cycle Indicator.
It is still in the expansion phase. Don’t be fooled by prognosticators claiming the U.S. economy is due for a recession. This economic cycle has been long, but it hasn’t been large in terms of GDP per capita. A few more years of growth wouldn’t be unprecedented if the global economy continues this latest surge in trade growth.
Sources
https://www.wto.org/english/news_e/news17_e/wtoi_07aug17_e.htm
An inverted yield curve, a clear sign investors see an impending recession, may be just around the corner https://t.co/ZL8sRnsihZ pic.twitter.com/uC3qFYrsEf
— Bloomberg Economics (@economics) October 12, 2017
#Goldilocks pic.twitter.com/Fh5qHuVfOe
— Callum Thomas (@Callum_Thomas) October 17, 2017
MS US cycle indicator remains in late cycle / expansion mode pic.twitter.com/eh9azkNim8
— Alex (@MacroOps) October 17, 2017
BAML: This credit cycle has more time before it turns (thinks 15/16 energy shock set clock slightly back) & less debt accumulation than past pic.twitter.com/rIduM9Qm2r
— Andrew W. Park (@apark_) October 16, 2017
Have comments? Join the conversation on Twitter.
Disclaimer: The content on this site is for general informational and entertainment purposes only and should not be construed as financial advice. You agree that any decision you make will be based upon an independent investigation by a certified professional. Please read full disclaimer and privacy policy before reading any of our content.

