UPFINA's Mission: The pursuit of truth in finance and economics to form an unbiased view of current events in order to understand human action, its causes and effects. Read about us and our mission here.
Reading Time: 4 minutes
Studying the labor market to determine the strength of overall wage growth is challenging. There are many stats which contradict each other. Economics is like the stock market in that there is always a positive and a negative case. It’s best to hear both sides before formulating a conclusion. Having an accurate perspective on the future is critical as that determines your investments, capital management and risk allocation. If you think the labor market is strong, you will be overweight retail and other ‘risk on’ sectors. For instance, if you think the labor market is weak, you would invest more in utilities than retailers.
Nothing stirs more controversy than the labor market, starting with the debate whether to rely on the unemployment rate or whether the labor force participation rate is a better indicator of the job market health. As we have stated previously, the truth is probably in the middle, and both are needed to accurately understand the labor market. Bullish investors tend to side with the optimistic scenario that wage growth is strong while bears side with the argument that wage growth is muted. This is a ‘chicken or the egg’ scenario.
The contributions to year over year hourly earnings growth is shown in the chart below.
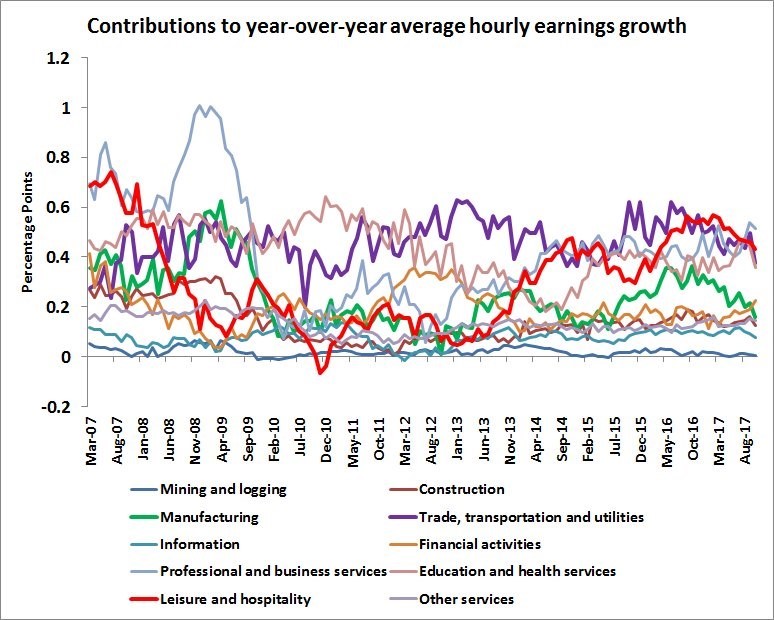
Hourly Report Shows Manufacturing Wage Growth Decelerating
There recently has been weakness in manufacturing and the trade, transportation, and utilities industries. This runs counter to the job growth in those sectors of the economy that we’ve seen this year. There are certainly changes arising from the hurricanes, but this chart shows longer term trends that last longer than a couple of months. One interesting potential reason for why this data shows negativity in the face of a positive environment is because there’s a shortage of skilled workers in manufacturing as we have detailed previously. The Chicago PMI report mentioned that many skilled workers are working overtime and temporary workers are being hired to make up for the lack of qualified workers. Therefore, there may be many jobs which offer higher wages that aren’t being filled. Secondly, working longer hours is great for laborers as they earn more money. This chart only shows hourly earnings, so it’s not a complete picture of the labor market.
On the opposite side of the ledger we have the employment cost index wages and salaries, as measured by the BLS. In the most recent report there was growth in blue collar wages in particular as the white collar jobs lagged. That’s an unusual occurrence which was applauded by some economists because America’s Rust Belt, which has many manufacturing workers, has been hollowed out as the jobs have been shipped overseas to Asia and South America. Some of the jobs have also been lost to automation.
As you can see from the 6 charts below, the blue collar wages earned are all headed in the positive direction. The transportation and material moving industry, unlike what was seen in the chart above, is seeing accelerating wage and salary growth, reaching a higher peak than what was achieved in the previous business cycle.
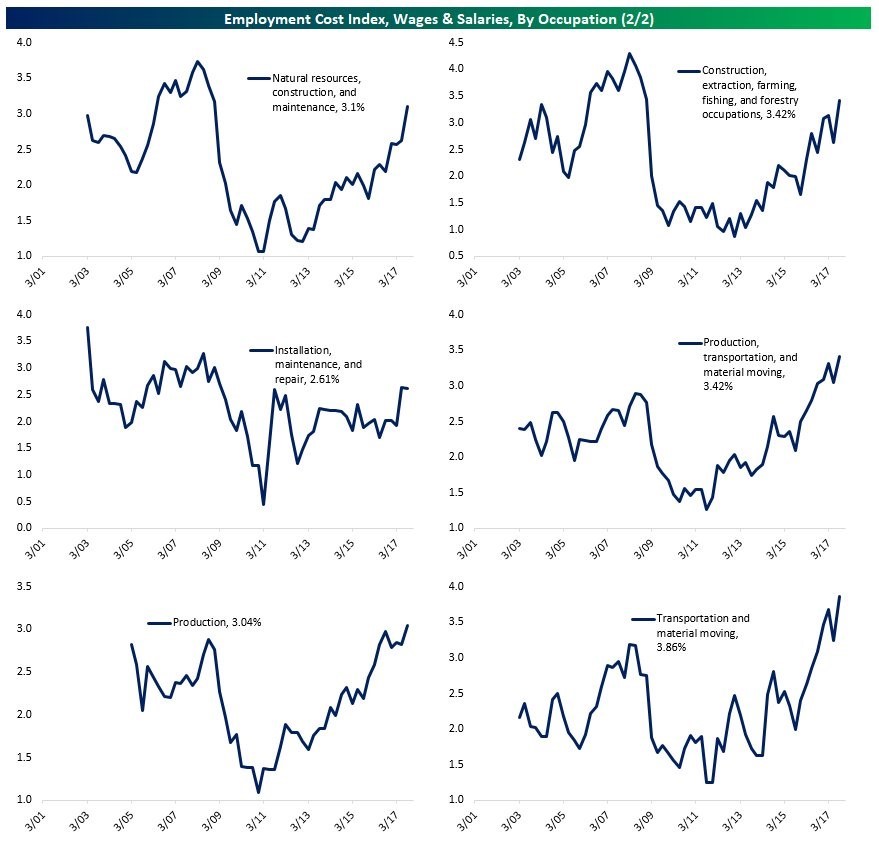
Employment Cost Index Shows Blue Collar Gains
We looked at the discrepancy among some calculations within the blue collar workforce and came to the conclusion that it has picked up recently. Let’s now look at the overall market with a focus on production/non-supervisory workers. This debate between those who think wage growth is great and those who don’t has monetary policy implications. If wage growth is weak, an argument by economists in favor of accommodative monetary policy would be made and if wage growth is strong, an argument in favor of tighter monetary policy would arise. Given the low inflation for everything but food, energy and asset prices, if wage growth is decent, we are living in a perfect world where costs don’t go up for consumers and workers get a pay raise. That’s actually not an improbable scenario because commodity prices have been remarkably stagnant. Emerging markets have thrived in a low commodity price environment because they are making up the gains via volume growth, aside from countries whose main export is commodities. As a side note, a big reason for increasing prices for goods is less competition, which is also largely a function of monetary policy. The effects of inflation, which by definition is the creating of currency in excess of the money supply, permeates throughout the economy in often indirect and sometimes unusual ways.
The average hourly earnings growth from production and non-supervisory workers is shown below.
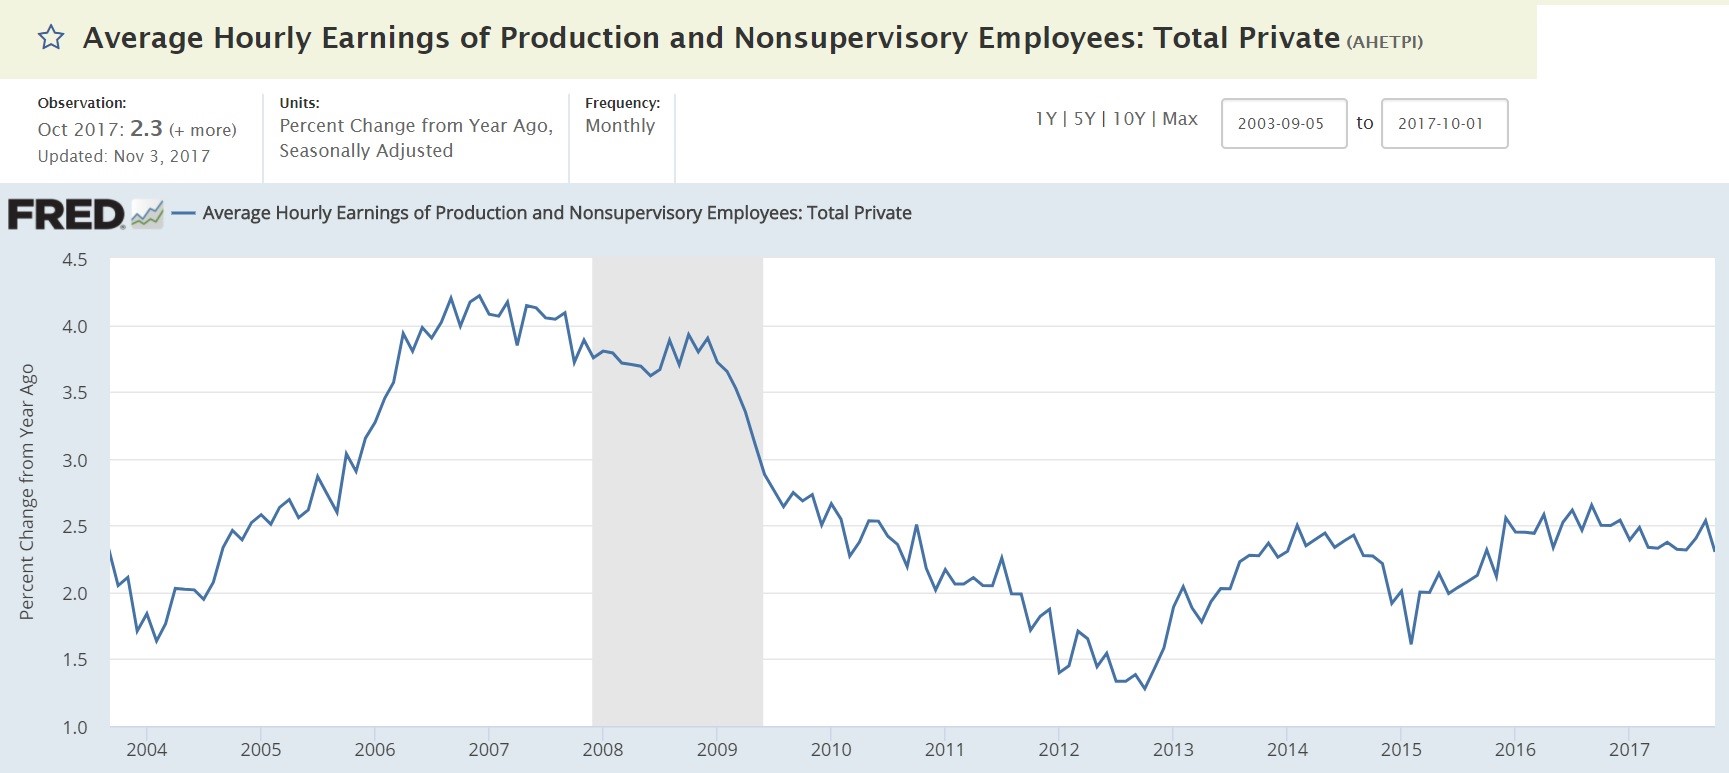
Average Hourly Earnings Growth For Non-Supervisory Workers
The chart shows that earnings growth in the past few months is near the fastest of this recovery, but it’s about half the growth rate seen in 2007. The problem with this chart is that it’s vulnerable to composition effects, meaning changes in job trends among industries. The Atlanta Fed wage growth calculator and the Employment Cost Index adjust for composition effects to reflect the underlying wage pressure that changing employment share may be masking.
To be clear, the latest Employment Cost Index report showed 2.61% wage growth in October and the Atlanta Fed wage tracker shows 3.6% growth in September. These differences all matter because if price inflation increases modestly from below 2% to slightly above 2%, according to the average hourly earnings of non-supervisory workers report, real wage growth wouldn’t exist. Although the unemployment rate isn’t the best stat to analyze the labor market because it doesn’t account for labor participation, let’s just mention that the average of the last 6 cycles had the unemployment rate bottom at 3.8%. With the rate at 4.1% as of October, we’re close to the end of the cycle.
Conclusion
Studying economics is difficult because stats often contradict each other. When that happens, the best course of action to take is to see where the numbers come from. Hopefully, we explained well where some wage growth metrics come from and which are the best to use. The takeaway is that nominal wage growth is below the last cycle peak, but it’s accelerating, especially for skilled manufacturing and transportation workers.
Have comments? Join the conversation on Twitter.
Disclaimer: The content on this site is for general informational and entertainment purposes only and should not be construed as financial advice. You agree that any decision you make will be based upon an independent investigation by a certified professional. Please read full disclaimer and privacy policy before reading any of our content.


