UPFINA's Mission: The pursuit of truth in finance and economics to form an unbiased view of current events in order to understand human action, its causes and effects. Read about us and our mission here.
Reading Time: 6 minutes
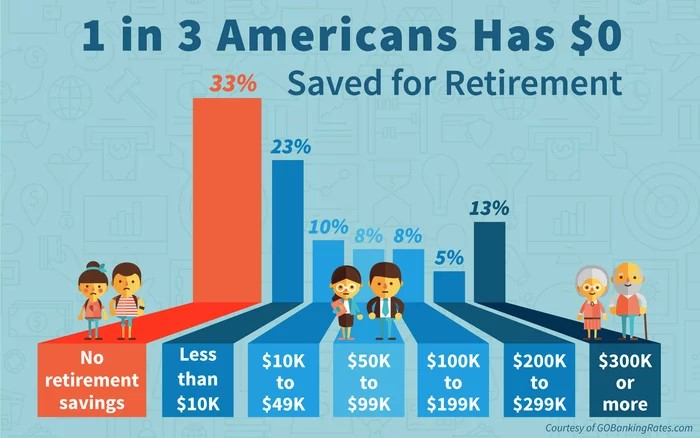
Dire Or Choosing Not To Save?
The health of the consumer is a hotly debated topic because stats are cited that show a large percentage of Americans don’t have much saved for retirement, yet the unemployment rate which is not a perfect measurement is at 4.1% which indicates a healthy labor market. As you can see in the infographic below, 33% of people have no money saved for retirement. By the time people retire, they will need more than $300,000 saved, but most people surveyed aren’t about to retire. To understand how the age difference affects the numbers, 42.2% of millennials aged 18-34 don’t have retirement savings and 28% of baby boomers 55 and older don’t have savings. 4.9% of millennials have over $300,000 saved and 22.4% of boomers have $300,000 saved.
Few Have Enough For Retirement
The point of this is to show how few Americans are well off enough to adequately save for retirement. The other side of the coin is some people might have a ‘spend now’ mentality. Some people want to enjoy their money while they still can. They also may be ok with retiring later in life. Depending on what job you pursue and your health, working into your 70s can be gratifying. To get an idea of how bad some people think the economy is we have a Twitter anecdote. When discussing the blue collar wage growth, someone commented that a full time job can only provide food. While this is a clear exaggeration, it shows how dire some people feel the economy is.
Systemic Issues Remain, Cyclical Trends Reviewed
For the most part, we will assume the consumer is in decent shape. While some systemic issues remain, those issues are likely ingrained in society. The key is to look at the cyclical changes the economy undergoes. We aren’t ignoring topics like the high incarceration rate in America, but when making projections for the next couple years, we need to check up on trends that change based on the health of the consumer. It’s true that the consumer doesn’t have much money saved for retirement, but that isn’t a statistical death sentence as we explained earlier. The chart below shows the weekly federal tax collections. The green line is the wage withholdings. Wage withholdings show nominal wage growth along with the increased number of workers in the labor force. As you can see, the growth is near the 2 year high at about 6%. This information is a framework for the way we view certain stats like the retirement savings one we reviewed earlier.
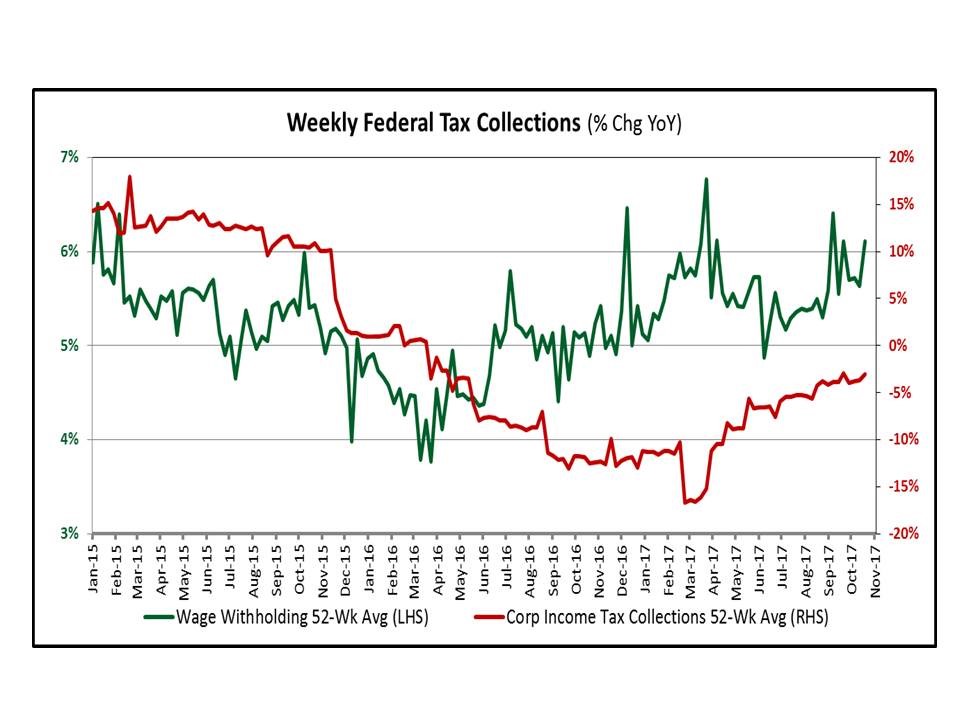
Weekly Tax Withholdings
Debt Situation: Housing
The New York Fed released its Household Debt and Credit report in November for Q3 2017. It has great detail on the balance sheet of the consumer. Before we review this, recognize that higher leverage is possible because rates are so low. A high debt level doesn’t become a problem until either rates increase or the labor market craters. Defaults happen when things go wrong, such as job losses.
The latest report showed the total household debt is $12.96 trillion which is a new all time record. That indebtedness is $280 billion higher than the cycle peak in Q3 2008. It is 16.2% higher than the Q2 2013 trough. Every cycle should have more debt because of inflation, so this isn’t alarming at face value. It tells us that the cycle has been going on for a while, but not that it’s necessarily near the end. The reason why it took over 4 years after the recession for the debt level to bottom was because mortgage debt fell after the recession. That was the biggest real estate cycle unwind in many decades as the market hit a reset button, increasing the lending standards for mortgage debt as we detailed previously. Housing mortgage debt peaked at $9.99 trillion in Q3 2008. It’s now only at $9.19 trillion even though the population has increased.
The two charts below give a perfect explanation of this scenario. They also tie in the point of why so many people think the recovery has barely gotten underway. As you can see, the home ownership rate has been declining for every area in America up until the past few quarters. It’s reasonable to say that the rates 10-15 years ago were unsustainably high, but at the same time this has been a steep drop. The second chart shows the reversal of the first one. It shows the rental vacancy rate. Vacancy rates dropped because people moved out of homes and into apartments.
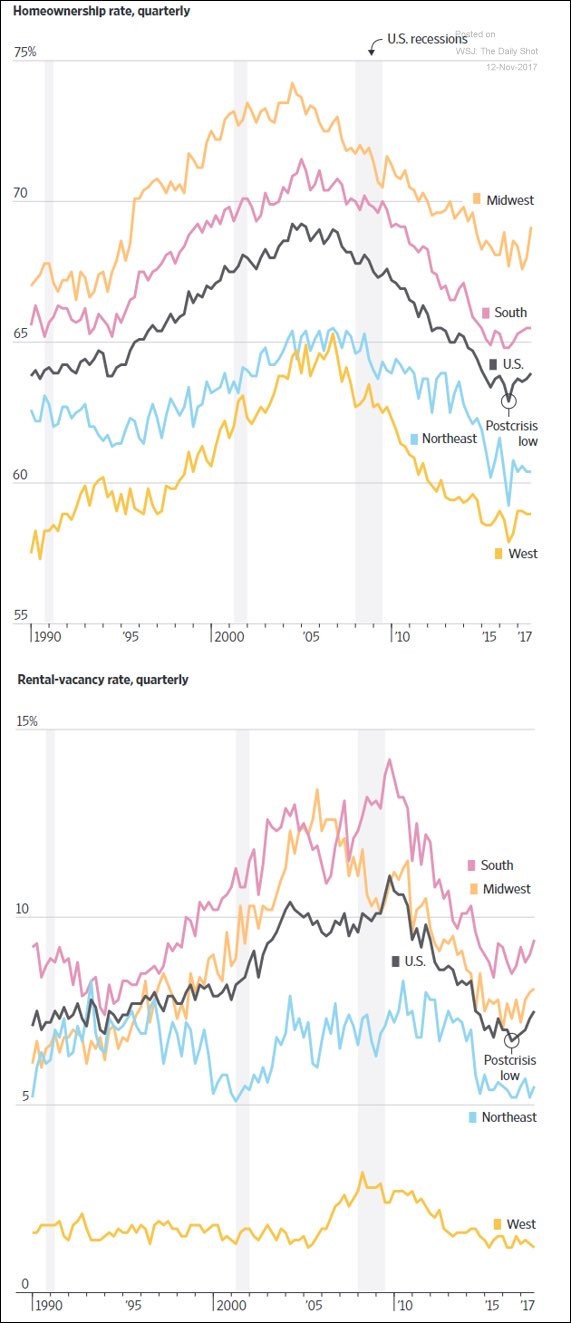
Home Ownership & Rental Vacancies
Debt Situation: Student Loans, Credit Cards, And Auto Loans
Getting back into the debt discussion, the non-housing debt has soared. Student loans, auto loans, and credit card loans all increased which allowed the total to reach a record $3.76 trillion. Credit card loans are actually below the Q4 2008 peak of $870 billion as they are now at $810 billion. However, credit card charge offs began to diverge from the unemployment rate recently, a potential signal to monitor further. The auto loans and student loans have been the big drivers of consumer debt this cycle as both are way above the previous cycle debt peak. Auto loans are at $1.21 trillion which is above the Q3 2005 peak of $830 billion. Student loans are at $1.36 trillion. They didn’t decline during the last recession, so let’s just point out that in Q3 2008 student loan debt was $610 billion, which means it more than doubled in 9 years.
One of the ways to tell when the cycle is nearing an inflection point is by looking at the delinquency rates shown in the chart below.
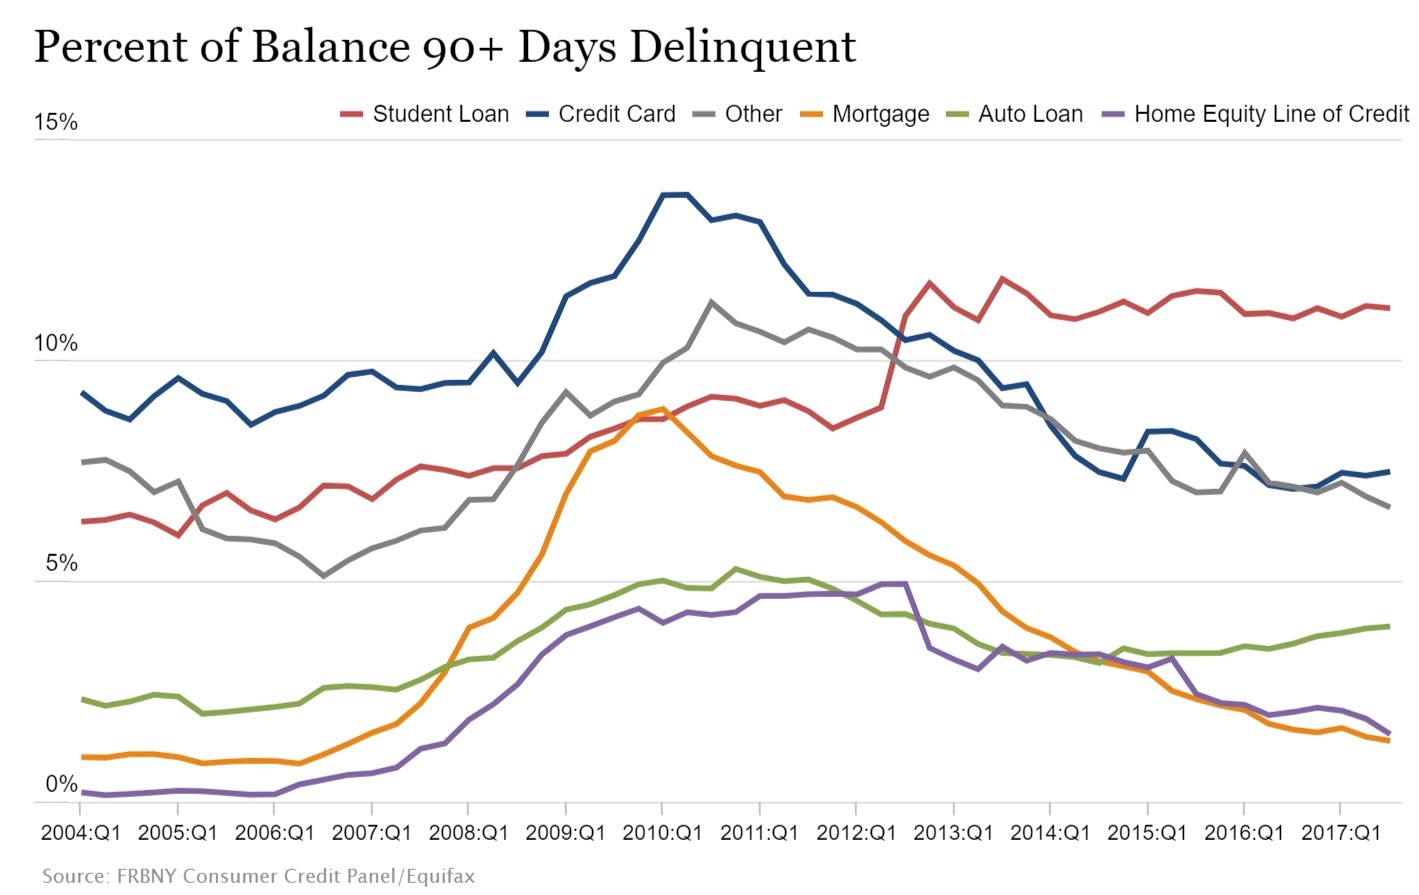
Delinquency Rates
The student loan 90+ days delinquency rate has been stubbornly high for 4 years. One great sign is even as the home ownership rate has ticked up recently, delinquencies continue to fall on mortgages. Well qualified buyers are getting out of apartments and into houses. Finally, we can see the auto loan delinquency rate is increasing.
The chart below explains where the problem is.
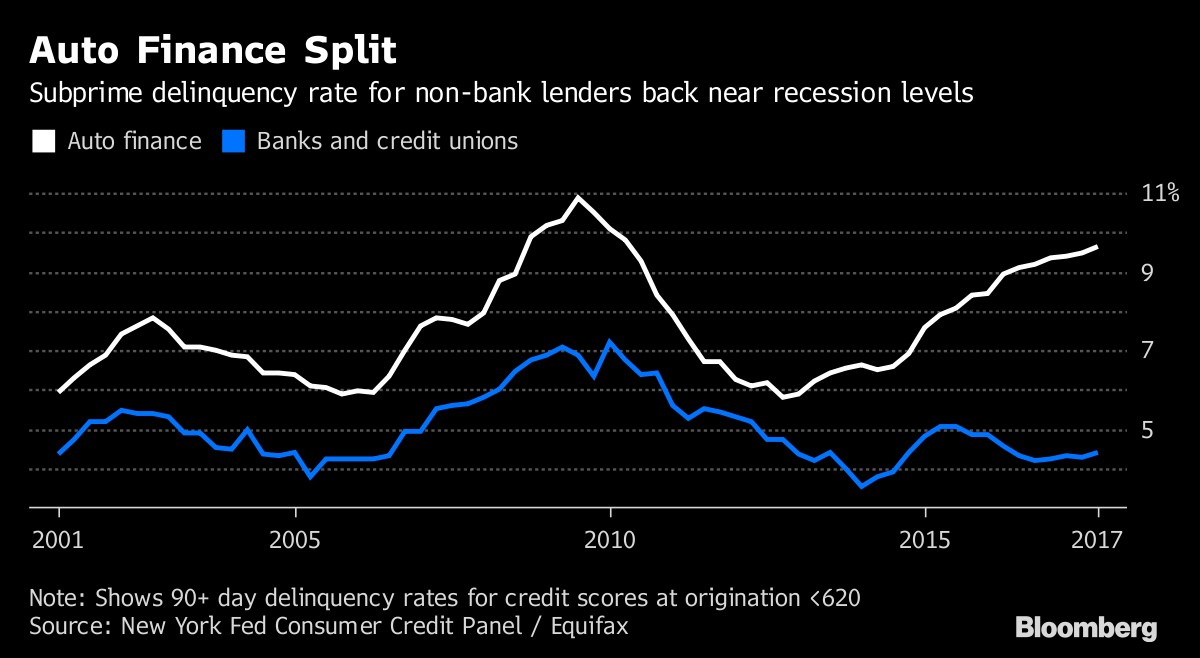
Auto Finance Is In A Bind
Auto finance firms are seeing close to crisis level delinquency rates while the banks and credit unions aren’t seeing many problems. This is because auto companies lower their standards to lock in sales. The auto finance firms dominate the subprime market. This situation is similar to the blowup at Signet Jewelers where the company lowered standards to generate jewelry sales and ended up eating crow because of the high default rates.
Conclusion
These charts give you an idea where the consumer is at. Tax withholdings are up and so is debt. The debt will be a problem when rates go up or the economy tanks. For now, even though very few people have enough money saved for retirement and the home ownership rate is low, and the consumer is relatively healthy. We’ll leave you with the chart below which shows the foreclosure and bankruptcies.
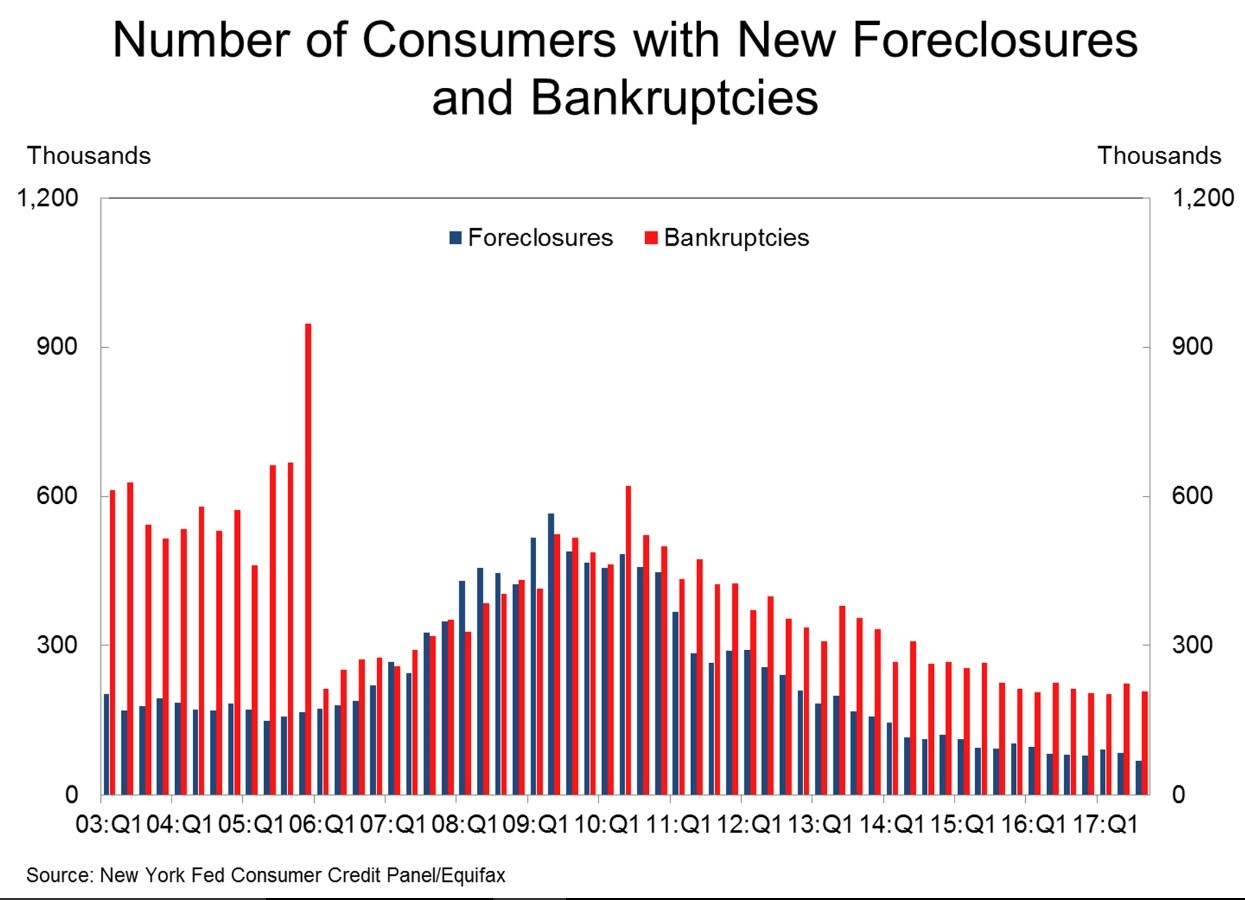
Foreclosures And Bankruptcies Are Low
As you can see, foreclosures and bankruptcies are historically low, implying the consumer is healthy. Cynics will say there are less people with a mortgage to default on. The counterpoint is that many people in 2005 were buying a house they couldn’t afford. A lower home ownership rate than that is more sustainable, suggesting that overall the US housing market is not in a bubble, despite increasing prices, aside from certain areas of the country.
Have comments? Join the conversation on Twitter.
Disclaimer: The content on this site is for general informational and entertainment purposes only and should not be construed as financial advice. You agree that any decision you make will be based upon an independent investigation by a certified professional. Please read full disclaimer and privacy policy before reading any of our content.


