UPFINA's Mission: The pursuit of truth in finance and economics to form an unbiased view of current events in order to understand human action, its causes and effects. Read about us and our mission here.
Reading Time: 5 minutes
Since the S&P 500 earnings are growing 26.62% and the NFIB small business index is 0.1 away from its record high, you would think everything is perfect. That’s actually not true as we will get to later in this post. First let’s review the reason the S&P 500 is at its record high. As you can see from the top table created by The Earnings Scout, the average earnings surprise of 473 firms in the S&P 500 this quarter was 6.7% as 81% of firms beat estimates.
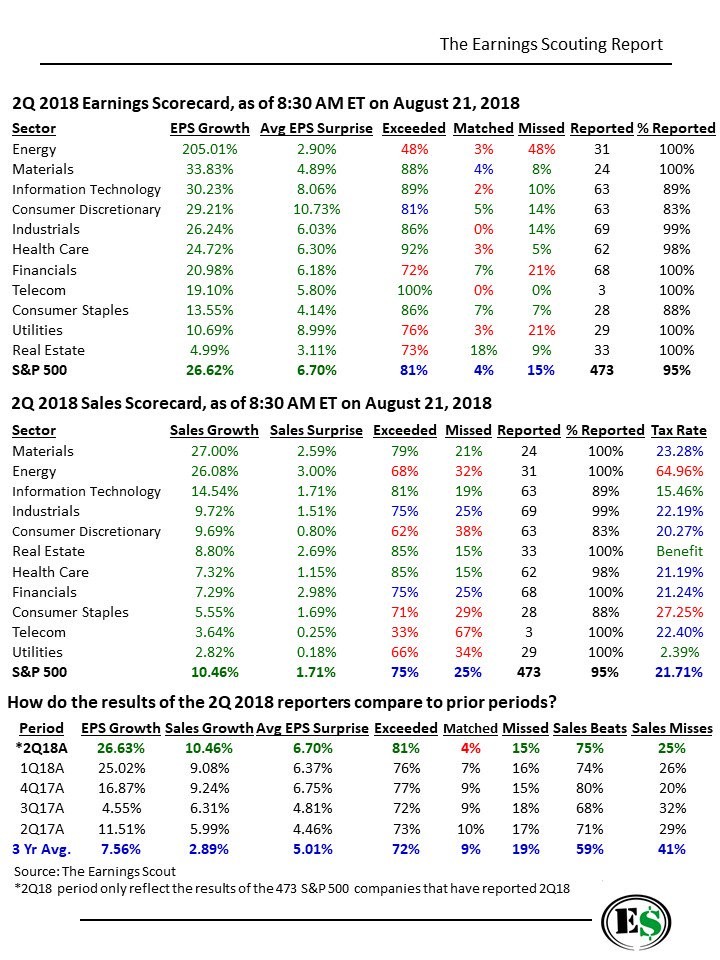
Consumer discretionary did the best since it had a 10.73% earnings surprise. It’s interesting that utilities had the 2nd to lowest earnings growth rate, but the second highest beat rate. On the other hand, energy had the highest growth rate, but it had a surprise rate of 2.9% and only 48% of firms beat estimates which were the worst on both fronts. Energy has been helped by oil on a year over year basis, but recent trends indicate that may not hold in 2019.
The second chart shows sales growth was equally remarkable as the average growth rate was 10.46% and the average beat rate was 1.71%, with 75% of firms surpassing estimates. You can see the strong earnings growth in utilities was driven by the tax cut because its effective tax rate was only 2.39% and its sales growth was only 2.82%. The materials sector had the strongest growth at 27% and energy had the best surprise rate at 3%.
The third table shows this quarter compared to the most recent ones and the 3 year average. Some bearish investors mistakenly claimed Q1 was going to be the growth peak. It seems likely that Q3 will be the growth peak. Q2 had faster EPS growth, sales growth, a better EPS surprise rate, and a higher percentage of firms beating sales estimates than Q1. In the past 3 years, which includes the earnings recession in late 2015 to early 2016, the average beat rate is 5.01% since firms have issued guidance they can beat, and analysts follow guidance when setting estimates.
Tale Of Two Cities: The Small Caps Are Struggling
As we mentioned, the NFIB small business index is looking great and the S&P 500 earnings growth is strong. However, the Merrill Lynch chart below shows not all companies are prospering. It shows the percentage of Russell 2000 members which aren’t making any money. It’s remarkable to see that the percentage has increased even after the commodity crash and slowdown in 2015-2016 have ended.
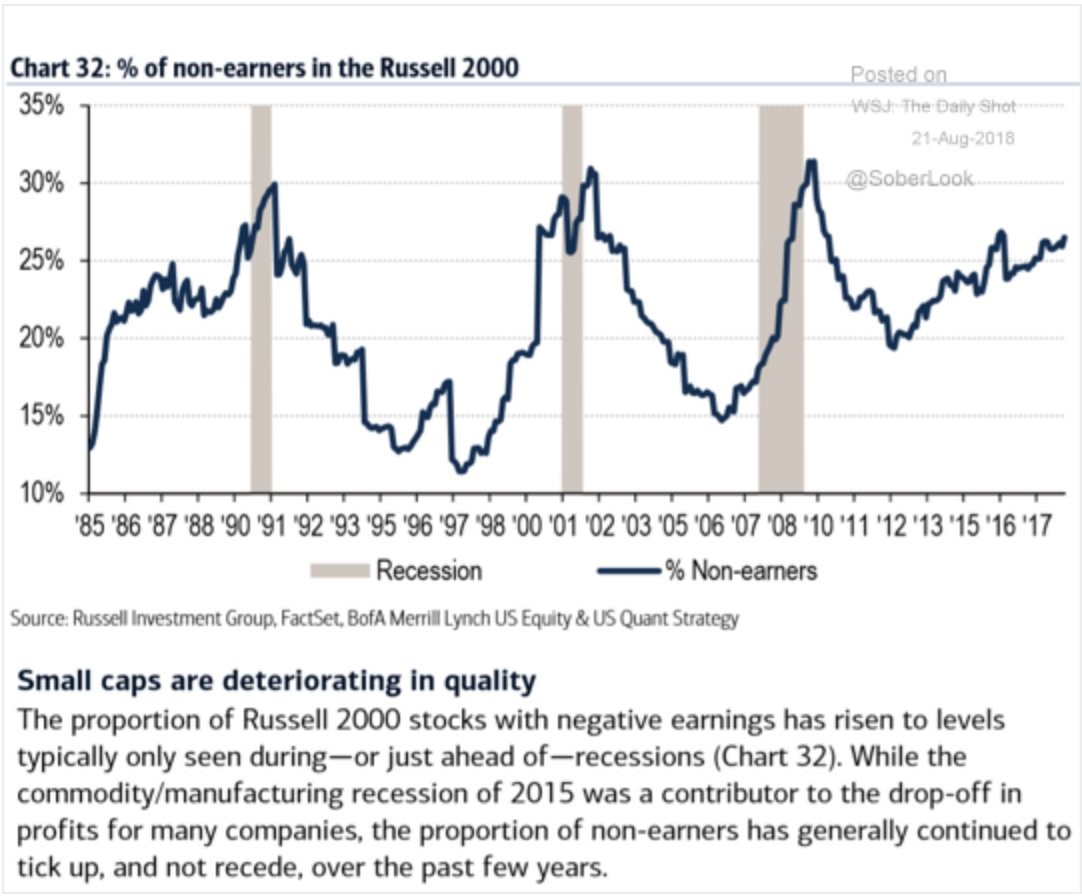
The economy has recovered, but over 25% of Russell 2000 firms don’t make money. This is while the Russell 2000 is at its record high and up 11.89% year to date. The Russell 2000 has been helped by the strong dollar and the improving economy, but many firms are poor operators. To get in the S&P 500, a firm needs 4 straight quarters of as reported profits. This explains why Tesla isn’t in the index even though it is one of the biggest auto makers in the country. It’s also important to recognize the cyclicality of this chart of non-earners. When the rate has been this high since 1985, the economy has been either in a recession or close to one.
Weakening Consumer Confidence
The August University of Michigan preliminary sentiment index was 95.3 which was so weak it missed the lowest estimate for 96. It was below the consensus and July report which were both 97.9. The expectations index didn’t change at 87.3, but the current conditions index fell almost 7 points to 107.8. This is bad news for August consumer spending. Bearish investors have been hanging their hats on the fact that future expectations are weaker than current conditions. This decline is validation for their arguments that the business cycle is almost over.
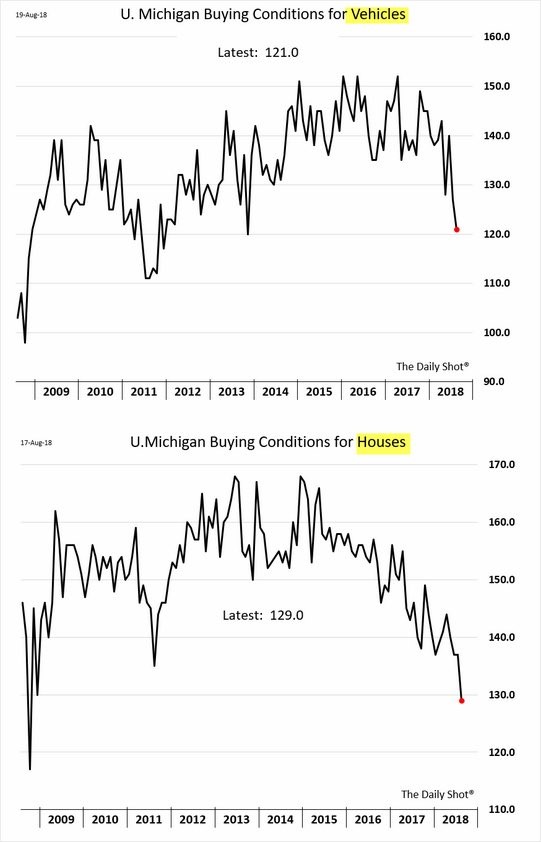
The U.S. stock market is at record highs. This makes it perplexing at first glance that consumer sentiment weakened. The reason it weakened while stocks rose is because the bottom third of the income distribution drove weakness. The bottom half of the country doesn’t own stocks. Another reason sentiment fell is because buying conditions for large household durables fell to a 4 year low and pricing perceptions were at a 10 year high. The top chart above shows buying conditions for autos fell to a 4 year low as pricing perceptions were the worst since 1984. The bottom chart above shows the buying conditions for houses fell to the lowest level since 2008 as it has been a sellers’ market for too long and prices have become unaffordable.
Role Reversal Between America and Europe
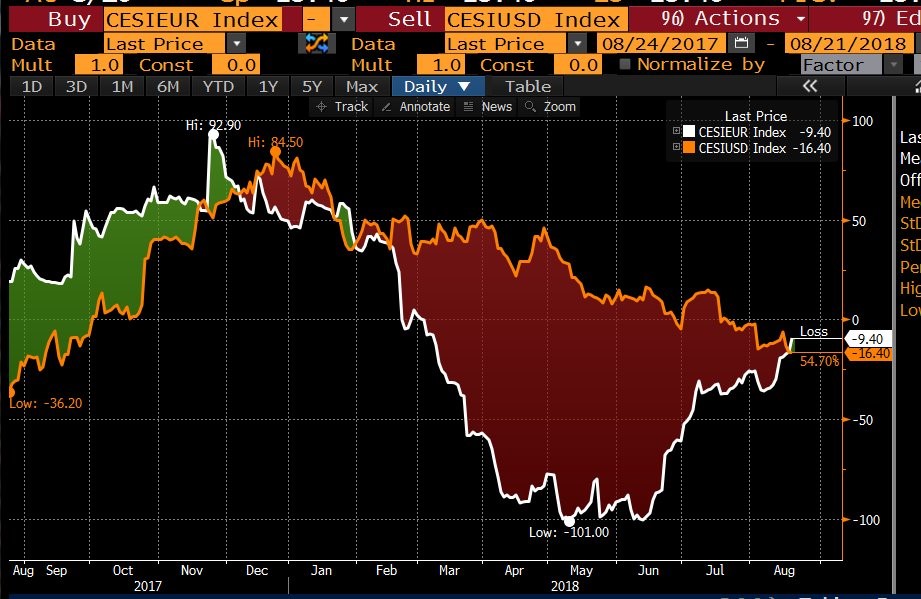
America has been dominating as its stock market is outperforming the world and the dollar has been soaring. The S&P 500 deserves to outperform European stocks because US stocks have higher earnings growth. However, the economic tides might be turning as the American economic surprise index is falling and the European surprise index is recovering. The weak Philly Fed and consumer sentiment are examples of recent disappointing U.S. economic reports.
U.S. Versus Emerging Markets
The chart below shows America’s outperformance over emerging markets.
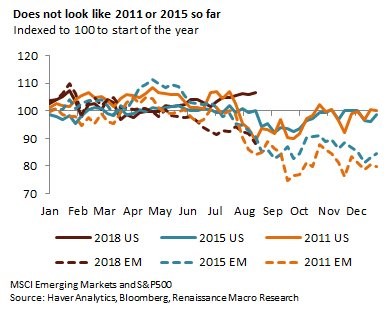
You have to wonder how long America can outperform with the economic surprise index showing weakness. The situation this year is different from the 2015 and 2011 emerging market routs as America is doing well this time since it is buoyed by the tax cuts and spending boost.
Conclusion
The U.S. stock market is rallying while there are some economic data points which should give investors pause. There is also the possibility of a trade war as Trump is promising a 25% tariff on European cars. The good news is Q2 S&P 500 earnings were amazing and the NFIB small business index is near its record high. The bad news is an increasing percentage of small companies in the Russell 2000 aren’t profitable even while the index is outperforming the S&P 500. With the emerging markets crating, the Russell 2000’s performance stands head and shoulders above others even while such a large portion of the index loses money.
Have comments? Join the conversation on Twitter.
Disclaimer: The content on this site is for general informational and entertainment purposes only and should not be construed as financial advice. You agree that any decision you make will be based upon an independent investigation by a certified professional. Please read full disclaimer and privacy policy before reading any of our content.


