UPFINA's Mission: The pursuit of truth in finance and economics to form an unbiased view of current events in order to understand human action, its causes and effects. Read about us and our mission here.
Reading Time: 5 minutes
The Fed’s Minutes from July 31st to August 1st mostly includes discussion about risk. This is logical because the economy is growing quickly and inflation is modest. When you have a situation which meets the criteria for a Goldilocks economy which has allowed stocks to reach record highs, you need to worry about what can go wrong. In this article, we’ll go into detail how the risks the Fed mentioned are playing out. To be clear, there is a 96% chance of a rate hike in September and a 62.8% chance rates are 50 basis points higher by December. These percentages didn’t change much because of the Fed Minutes.
Weakness In The Housing Sector
It’s obvious that weakness in the housing sector is a problem for the economy. We showed in a previous article that the buying conditions are at the lowest point since 2008 because of rising rates, depleted inventories, and expensive prices. In the Minutes, the Fed stated, “Starts for new single-family homes were little changed, on average, in May and June, but starts of multifamily units declined on net. The issuance of building permits for both types of housing was lower in the second quarter than in the first quarter, which suggested that starts might move lower in coming months. Sales of existing homes edged down in May and June, while sales of new homes moved up on balance.”
These points are all accurate. Let’s look at the July existing home sales report from Wednesday, which the Fed didn’t have access to a few weeks ago. Existing home sales were 5.340 million on a seasonally adjusted annual run rate basis which missed estimates for 5.42 million and the lowest estimate of 5.39 million. This is the 4th straight decline in existing homes sales as they were down 0.7% month over month and 1.5% year over year. Existing homes sales are at the lowest rate in 2.5 years as rising rates and a 0.5% decline in supply aren’t a good combination.
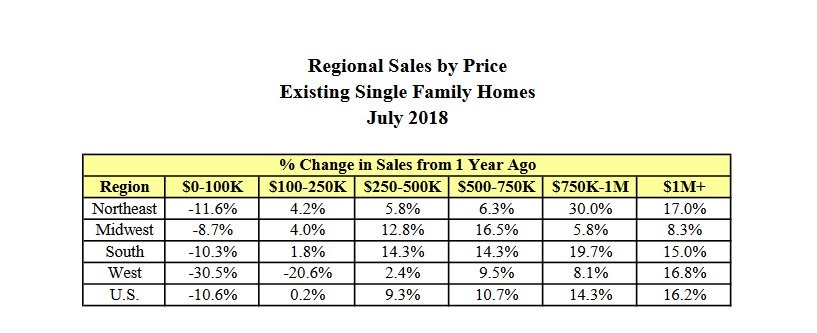
Interestingly, the decline is mainly coming from the low end of the market just like the how the bottom third of the income distribution catalyzed the weakness in the August consumer sentiment report. As you can see from the table below, single family houses costing less than $100,000 were the only ones which saw weakness in July. The higher the price, the greater the sales growth as the stock market is helping those with assets grow their net worth and buy higher priced houses.
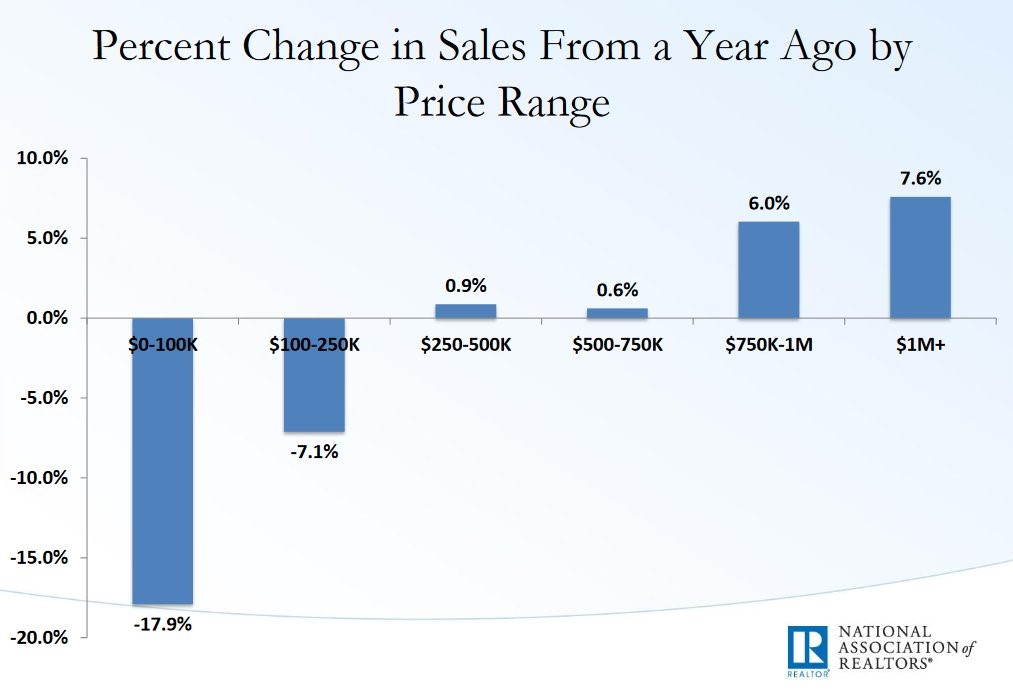
The second chart below shows the results from all forms of housing. As you can see, only the houses worth less than $250,000 saw declines. The houses worth over $750,000 had a solid increase.
Emerging Market Weakness
Individual countries within the emerging markets grouping have had weakness because of political instability. The Chinese economy is leading the way in the downturn, and is in fact the big tail risk, not Turkey. Emerging markets all don’t like the Fed’s rate hikes and the rising dollar. In the Fed’s Minutes it said,
“However, real GDP growth remained moderate in the euro area and appeared to have slowed notably in many emerging market economies (EMEs), especially Mexico, from an unusually strong start to the year. On net, equity prices were little changed in the AFEs, while they declined in the EMEs, led largely by a steep drop in China. Outflows from dedicated emerging market funds slowed, and EME sovereign bond spreads narrowed slightly.”
The chart below supports the point that emerging markets have seen weakness in their equities as the ratio between emerging market equities and developed market equities is at the lowest point in over 10 years.
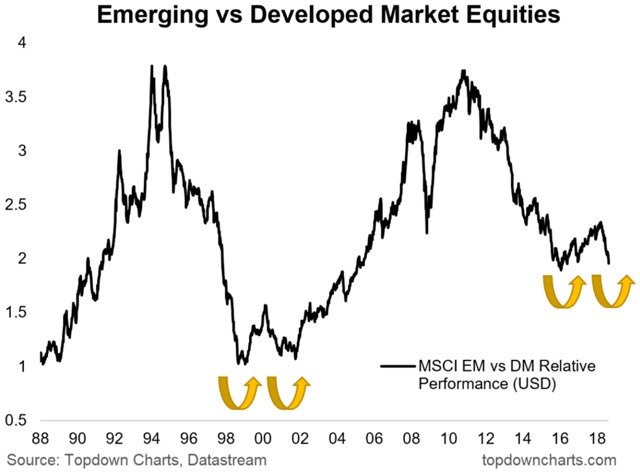
The Brazilian political situation hurts the grouping. It’s so bad that the leading candidate in the Brazilian presidential polls, Luiz Inacio Lula da Silva, can’t even run for office because he was jailed for his role in the Petrobras corruption scandal.
Wages & Inflation
On wage growth the Fed said,
“Many participants commented on the fact that measures of aggregate nominal wage growth had so far picked up only modestly. Among the factors cited as containing the pickup in wage growth were low trend productivity growth, lags in the response of nominal wage growth to resource pressures, and improvements in the terms of employment that were not recorded in the wage data.”
The chart below is an amazing depiction of why wage growth hasn’t led to an increase in PCE inflation.
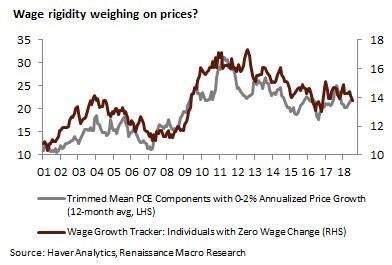
Even though the unemployment rate is at 3.9%, which is very low, an elevated number of workers haven’t seen a wage increase. The chart shows the high correlation between the trimmed mean PCE with below 2% annual price growth and the percentage of workers who have had zero change in wages. About 25% of PCE is below 2% and about 14% of workers have seen no change in wages.
Yield Curve
On the yield curve, the Minutes said,
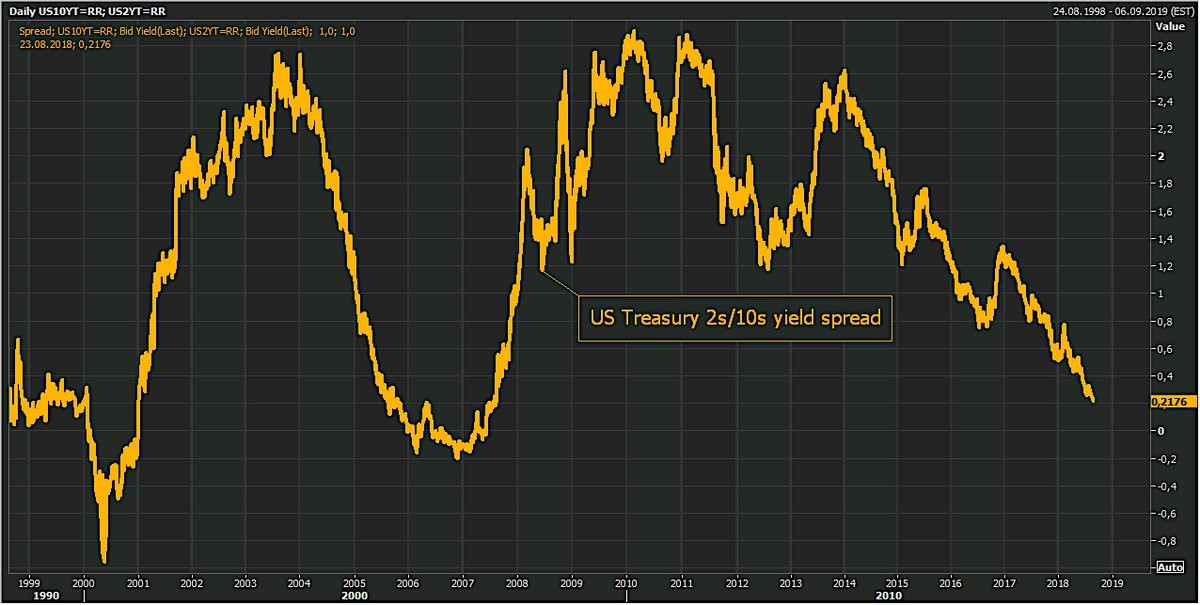
“Several participants cited statistical evidence for the United States that inversions of the yield curve have often preceded recessions. They suggested that policymakers should pay close attention to the slope of the yield curve in assessing the economic and policy outlook. Other participants emphasized that inferring economic causality from statistical correlations was not appropriate.”
Those who don’t think a recession will follow an inversion think the decline in term premiums will make the indicator not accurate. The decline in the term premium is said to be caused by central bank asset purchases and by a flight to safety catalyzing demand for treasuries. Keep in mind, this argument as to why an inversion won’t lead to a recession has been wrongly used before in previous cycles. The chart below shows an inversion is coming soon as the difference between the 10 year yield and 2 year yield is only 22 basis points.
Conclusion
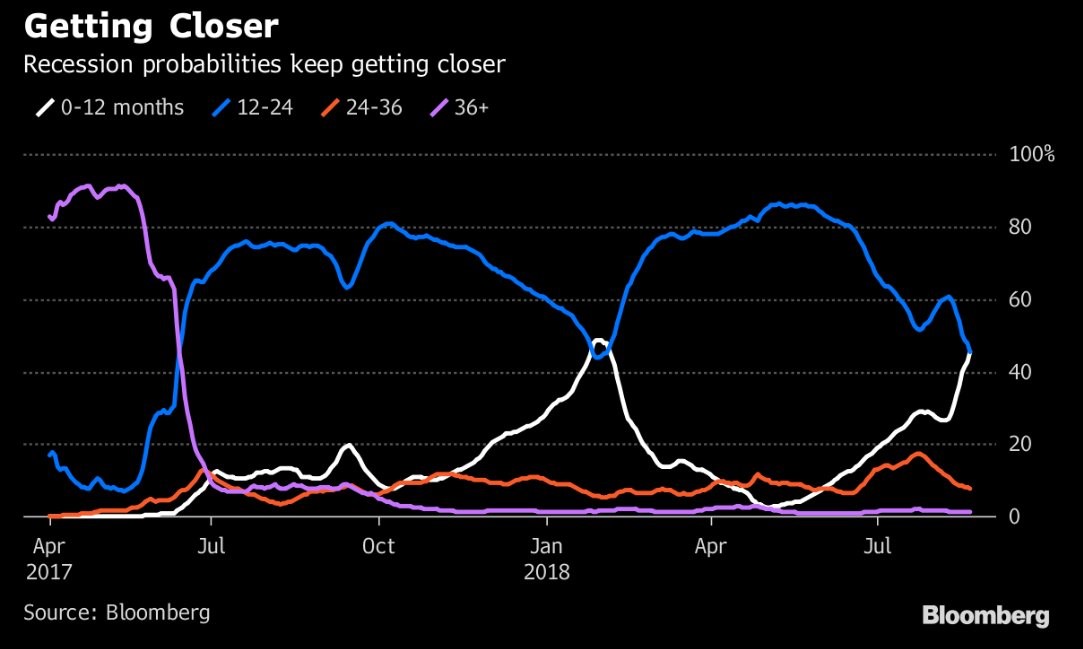
The Fed will be ignoring the risk from emerging markets and the flattening yield curve as it will be raising rates. It has ignored these risks this year. Raising rates doesn’t need to occur quickly due to low inflation. Hikes push the odds of a recession in the medium term up even though it seems like an unnecessary risk with core CPI only up 2.4% year over year. The chart below shows Bloomberg’s neural net algorithm shows there is now over a 40% chance of a recession in the next 12 months.
Even if a recession occurs in 2 years, it would be a shock to some because GDP growth was 4.1% in Q2. Keep in mind, you should not rely on any one indicator in an attempt to form a view about an entire economy.
Have comments? Join the conversation on Twitter.
Disclaimer: The content on this site is for general informational and entertainment purposes only and should not be construed as financial advice. You agree that any decision you make will be based upon an independent investigation by a certified professional. Please read full disclaimer and privacy policy before reading any of our content.


