UPFINA's Mission: The pursuit of truth in finance and economics to form an unbiased view of current events in order to understand human action, its causes and effects. Read about us and our mission here.
Reading Time: 5 minutes
When the Fed implemented QE, one of the benefits of it was said to be the wealth effect. The wealth effect is the benefit the economy gets from stock price appreciation. In theory, people who make money in the stock market are supposed to spend more money which helps the economy. It’s doubtful that worked in reality since stocks have been in a strong bull market, yet the economy has been in a slow expansion. Adding fuel to the fire of the discussion about whether stock appreciation is good for the economy is when President Trump mentions the price appreciation in the Dow since he was elected. Obviously, a better estimate of the stock market would be the S&P 500 or the Wilshire 5000. Either way, they are all up.
As you can see from the pie chart below, 50.7% of households own no stock.
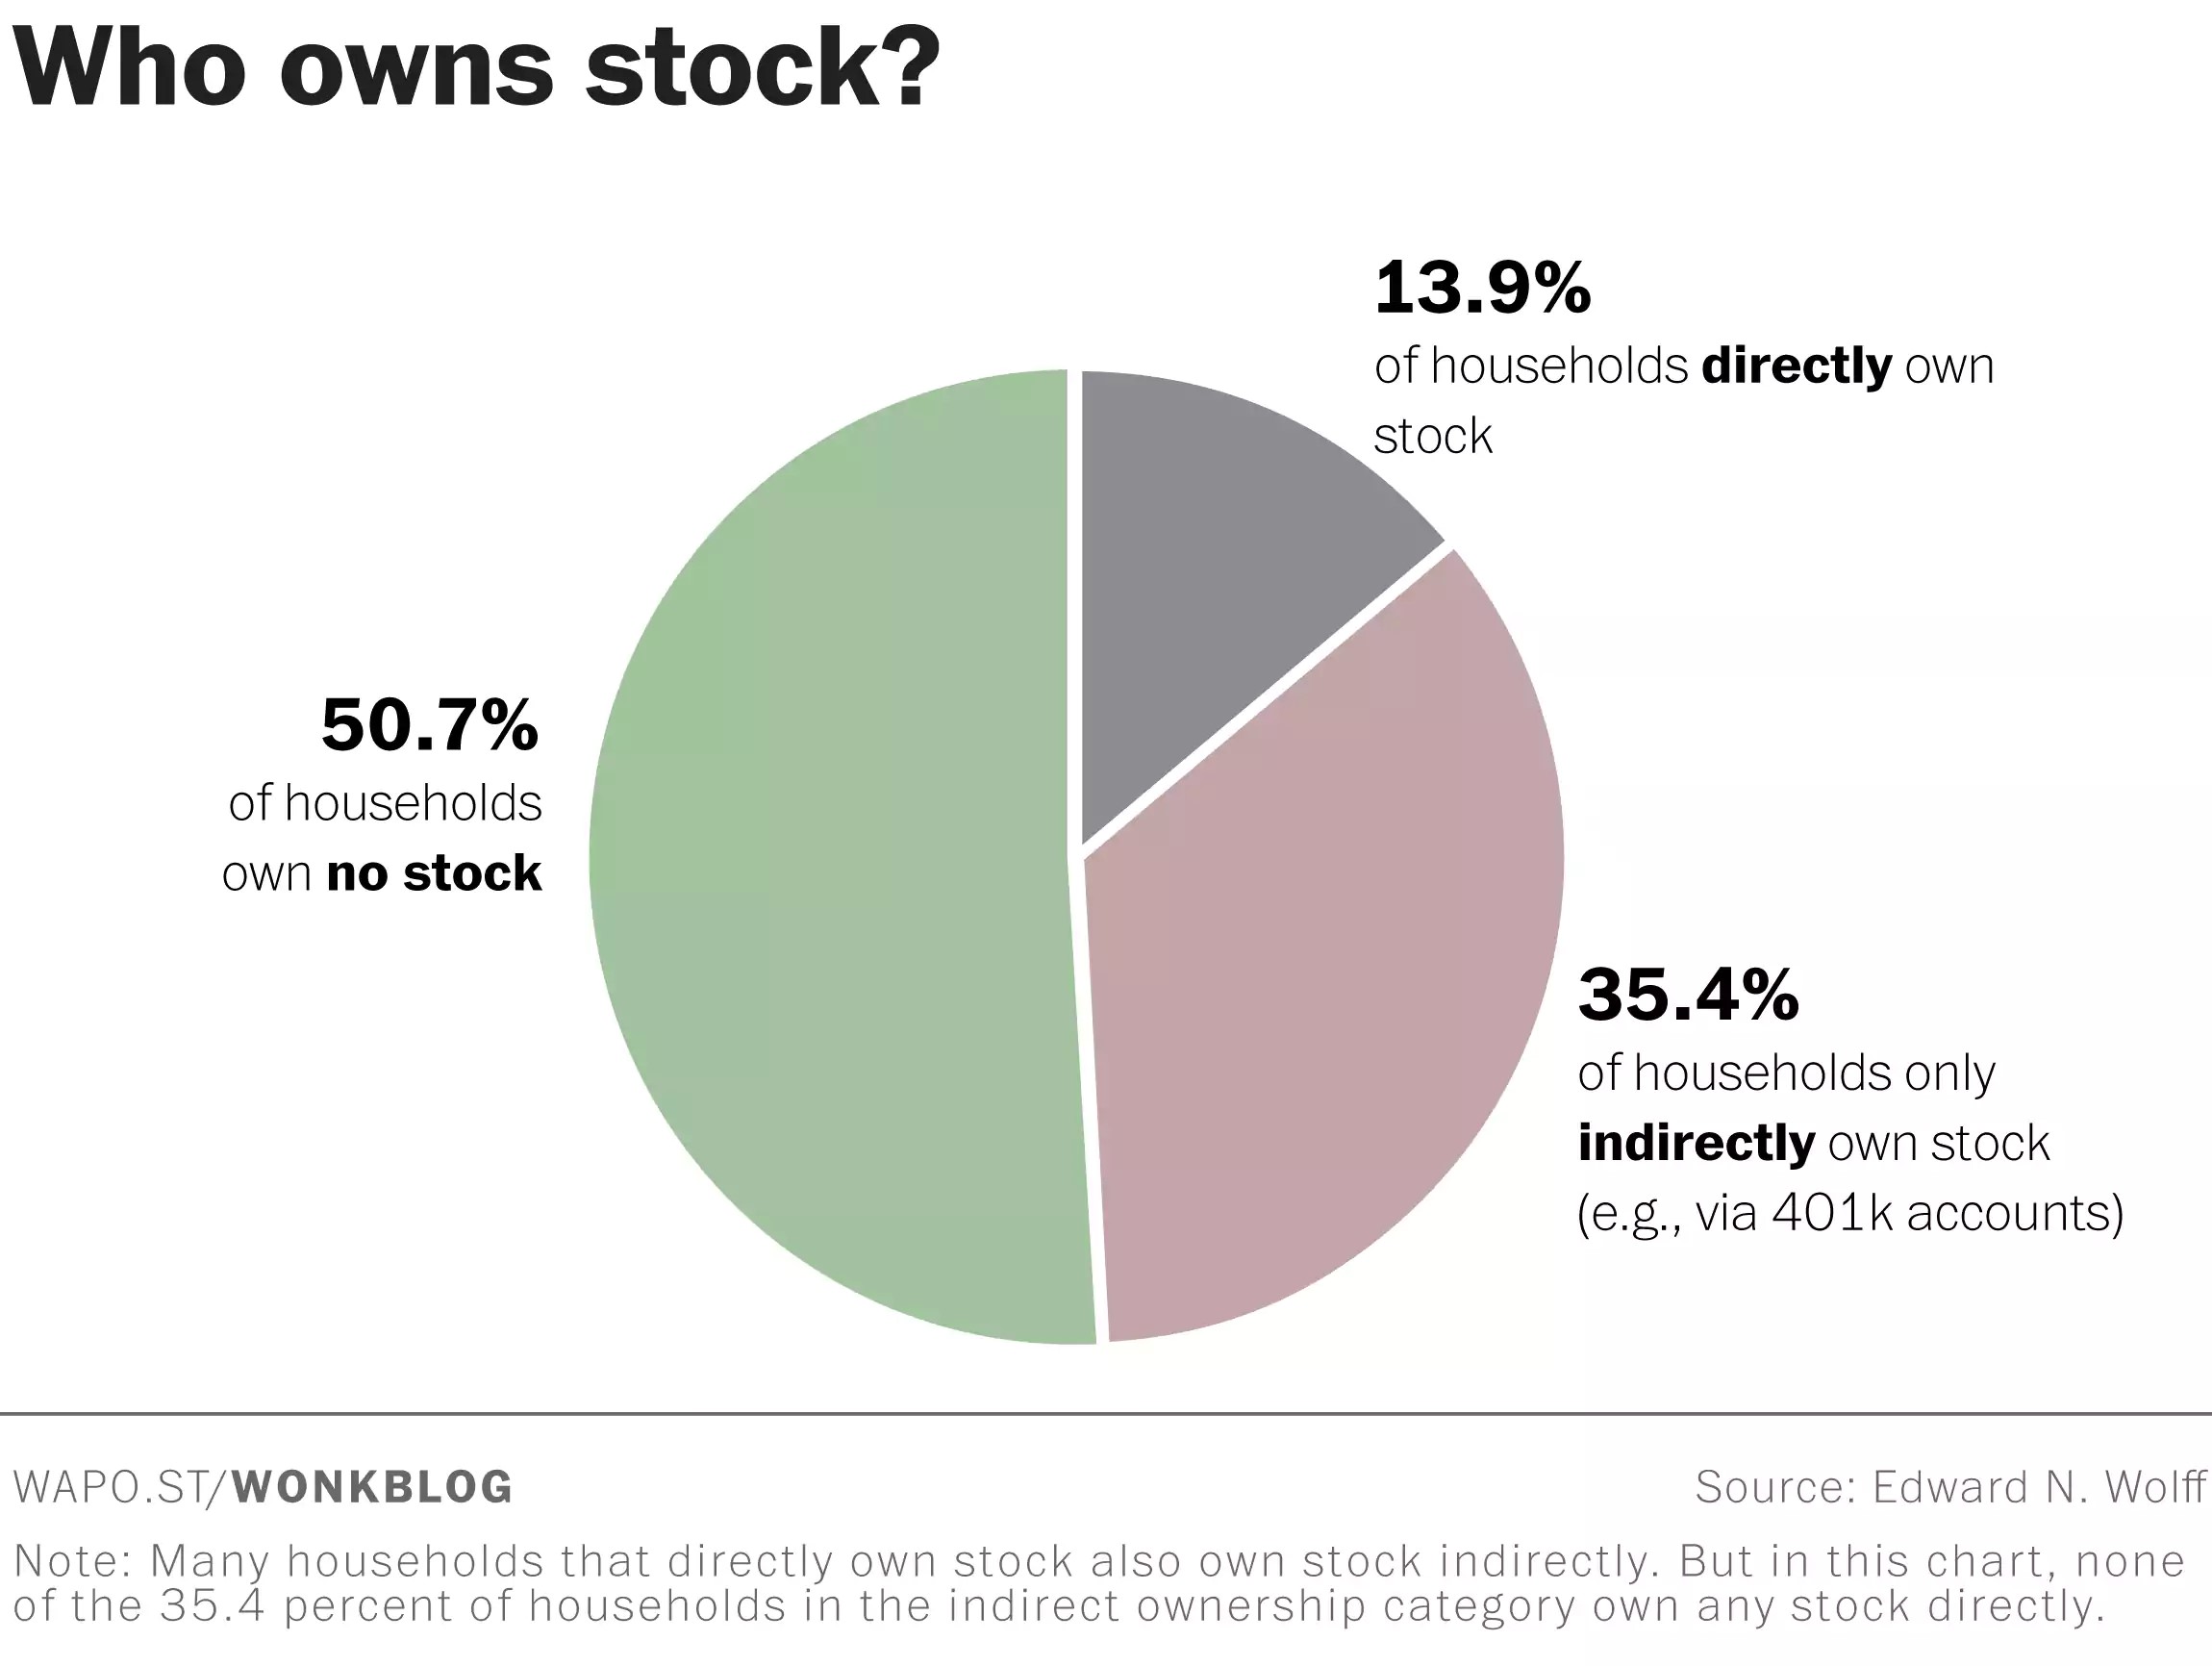
The Bottom 50.7% Don’t Own Stocks
That isn’t to say the households who don’t own stock don’t benefit at all from the stock market going up. Liquid capital markets allow for more companies to raise money. The more companies there are raising money, the better products there are for the consumer. For example, without capital markets, Facebook wouldn’t have been able to go public and invest in initiatives like Oculus.
With the caveats we’ve mentioned aside, the fact that 50.7% of people don’t own stocks means that the gains in this economy are mainly being realize at the top. This is especially true when you take into account the disappointing real non-supervisory wage growth and the low homeownership rate. If someone doesn’t own stocks, their small amount of savings is barely getting any interest at the bank. The interest on credit cards is still in the double digits. The only break the middle class gets is the low inflation in some goods like apparel and commodities like natural gas. Even though optimism about the stock market is high, that doesn’t mean everyone is getting involved. You need to have extra savings to put money in the stock market.
It’s Hard To Buy Stock When You Don’t Have Money To Spare
The chart below shows the historical ownership rate of direct holdings of any stock.
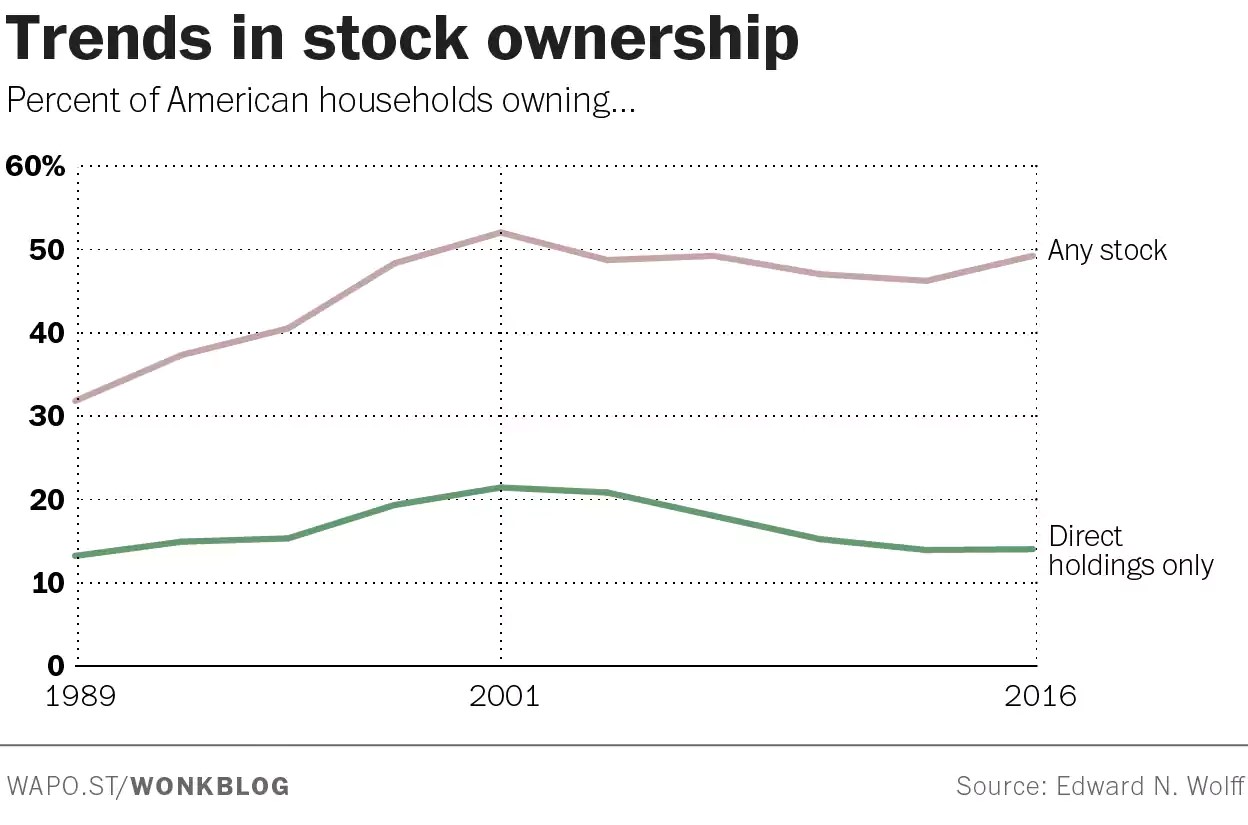
Stock Ownership Rose In The 1990s Helping Create The Most Expensive Market Ever
The direct ownership of stocks has fallen from 21.3% in 2001 to 13.9%. By the time the average person has enough money to invest in the market, the top will be in and the ‘dumb money’ will take losses once again. The ownership in any stock has also fallen from the peak in 2001. The quick growth in the 1990s of those owning any stock shows the trend in 401Ks being given out to baby boomers. This leads us to the point that demographics play a factor in why valuations have been high in the past few decades. Baby boomers are at their peak wealth. The more that retire, the less likelihood high valuations will continue.
Pensions Are Everything For The Bottom 90%
The top 1% owns 40.3% of all stock. The bottom 90% only owns 16% of all stock. The chart below reviews where the bottom 90% of people have their wealth.
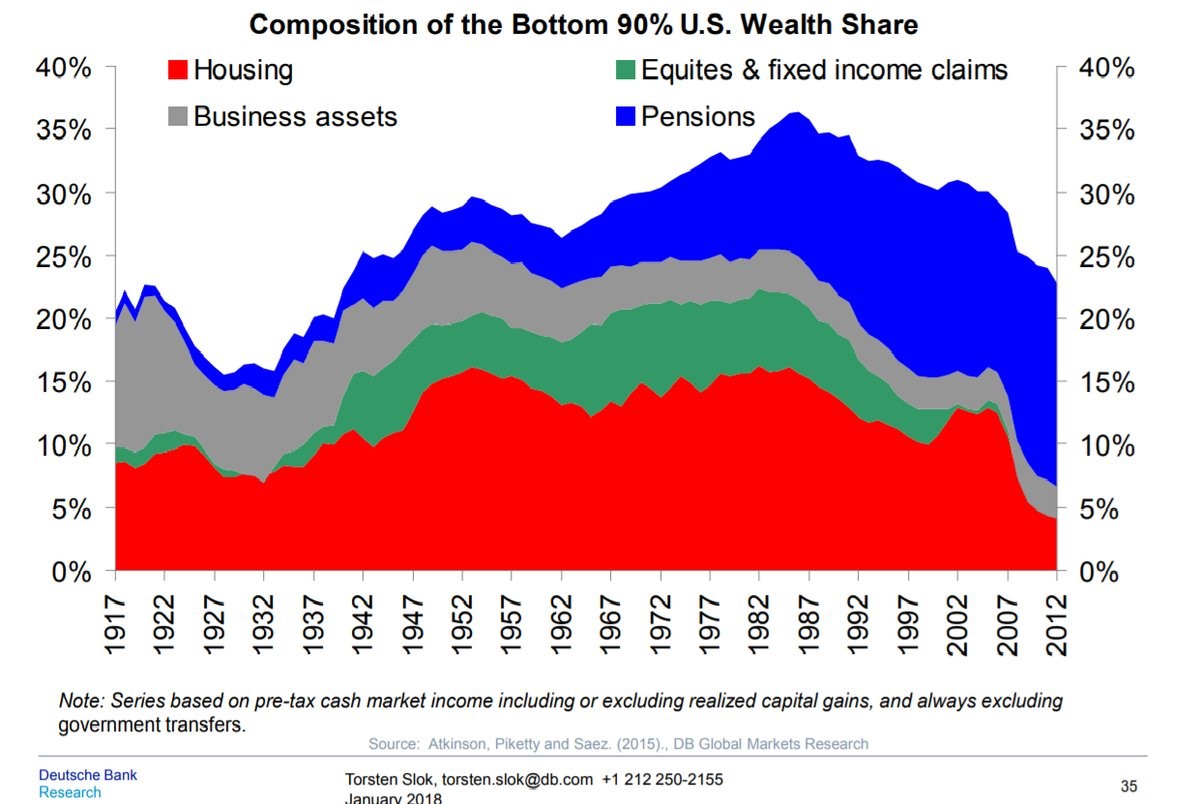
Wealth Share Of The Bottom 90% Has Fallen Because Of The Housing Crash
Inequality has grown since the late 1980s. The decline in housing wealth created by the bust in the housing market pushed down homeownership rates and has been responsible for the recent losses in total wealth share from those in the bottom 90%. Baby boomers have been the first generation to get a significant amount of money from pensions just as they were the first to get 401Ks. The demand that came from this boost in demographics created the need for such retirement programs. Secondly, previous generations didn’t live long enough to have the need for a large retirement next egg.
Public Pensions Put More Money In Equities To Make Up For Low Bond Yields
Pension funds need to make 7% to 8% per year to meet their obligations. That wasn’t difficult when all they needed to do was put money in bonds. Pension funds could simply buy the 10 year treasury bond and wait until maturity to meet their goals. In the past few years, low bond yields have put pressure on pension funds which usually hold bonds until maturity. If you held bonds as a trade, you’d be making money because yields have fallen for decades. However, holding them to maturity means you get the low yields they offer.
You can see in the chart that bond exposure has fallen in the past few decades. This pension fund aggressiveness is partially what has driven equity valuations so high in the past 20 years. The problem is that valuations are so high now that future returns in stocks likely won’t match the goals pension funds have set up. This situation could could blow up in their faces in the near term if stocks come back to anywhere near their long term average valuation.
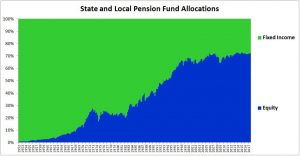
Pension Funds Increasing Exposure To Equities
Wilshire Consulting expects 6.25% compound annual returns for stocks in the next 10 years. Unfortunately for pension funds, that estimate probably won’t be met. As you can see from the chart below, the 30 year Shiller PE is at 42.11. That is over double the median which is 18.15. It’s only slightly off the peak of 49.9 in December 1999. The 5 year Shiller PE is indicating negative 5 year real returns per year as it’s at 29.91. The median is 15.49 and the peak is 36.01.
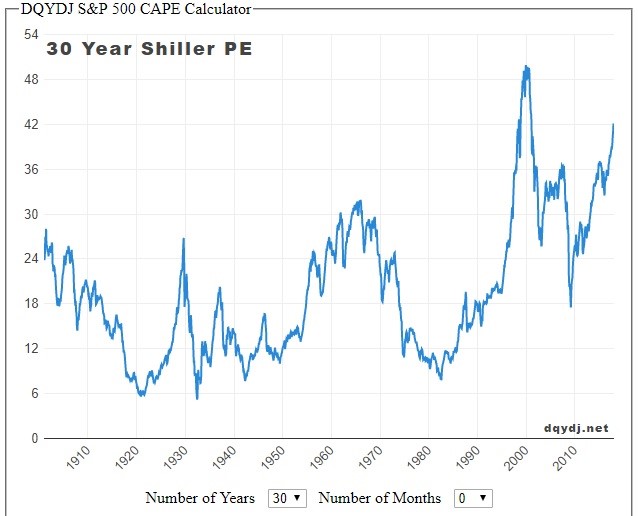
30 Year Shiller PE Implies Very Low Future Long Run Returns
Underfunded Benefit Plans
The truth is even if public pensions had better timing and stocks were undervalued now, implying solid long term future performance, they would still be in trouble. The promises made were too optimistic and the money collected isn’t enough to make up for the baby boomers retiring. As you can see from the chart below, the assets as a percentage of entitlements for state and local defined benefit plans has declined in the past 20 years, going from about 110% to above 60%. Pensions trying to outperform the market with alternative investments is the equivalent of trying to push a stalled car up a hill while wearing cement boots. It’s not going to work.
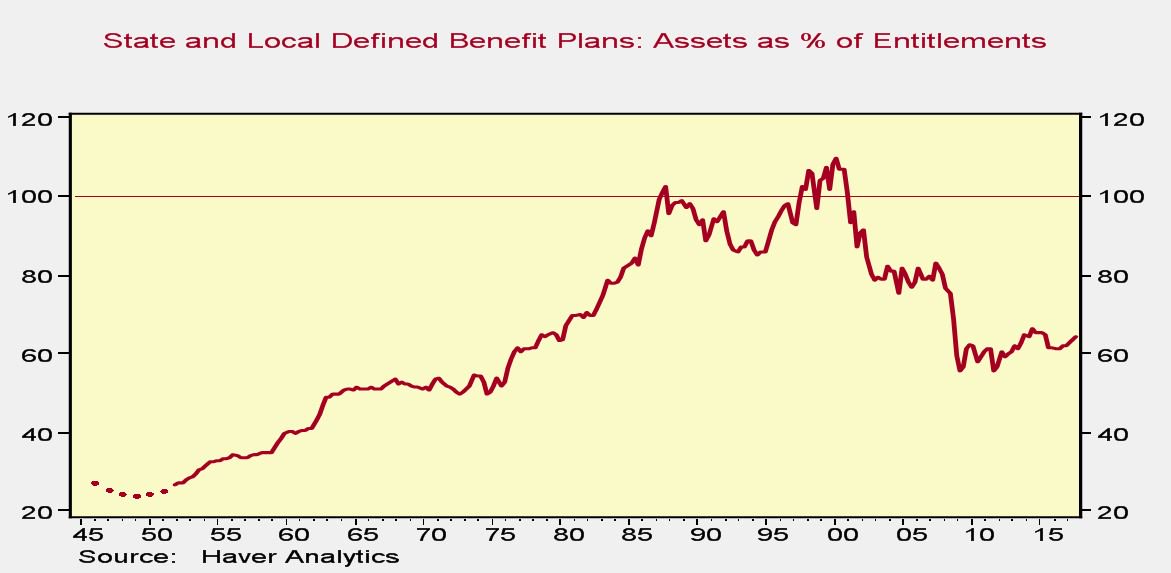
Benefit Plants Are Underfunded
Conclusion
For the most part, the bottom 50% doesn’t benefit much from increasing stock prices. The hope for the middle class in 2018 is wage growth occurs without commodity inflation. This can increase savings to put in the stock market. Unfortunately, by the time they put money into stocks, the market will probably be near its peak as the Shiller PE indicates the stock market is at its 2nd most expensive level ever.
Have comments? Join the conversation on Twitter.
Disclaimer: The content on this site is for general informational and entertainment purposes only and should not be construed as financial advice. You agree that any decision you make will be based upon an independent investigation by a certified professional. Please read full disclaimer and privacy policy before reading any of our content.


