UPFINA's Mission: The pursuit of truth in finance and economics to form an unbiased view of current events in order to understand human action, its causes and effects. Read about us and our mission here.
Reading Time: 5 minutes
In this article we’ll look at some of the economic trends within countries to get an idea of which countries are the most innovative. We’ll also look at the inequality trends among countries. As a general rule, the best countries implement free market reforms. Free choices let people and businesses innovate to meet the needs of others.
Inequality Among Countries
Let’s begin with how countries are doing in terms of inequality. Inequality is the distribution of household incomes. If you live in the US and follow the mainstream media, you probably have a misunderstanding of the issue. Socialist and communist countries are the ones with the most poverty and inequality. Just look at Venezuela to see how poverty has exploded because of failed socialist policies. When free will is suppressed, so is the quality of life. The greater the suppression, the more disastrous the quality of life, case in point, North Korea. In the US, while not the shinning beacon of freedom nor a truly capitalist society, relative to other countries, still provides among the best opportunities for people.
With that in mind, the chart below shows the changes in inequality as measured by the changes in the percentage the top 1% make of the total gross income and the Gini coefficient.
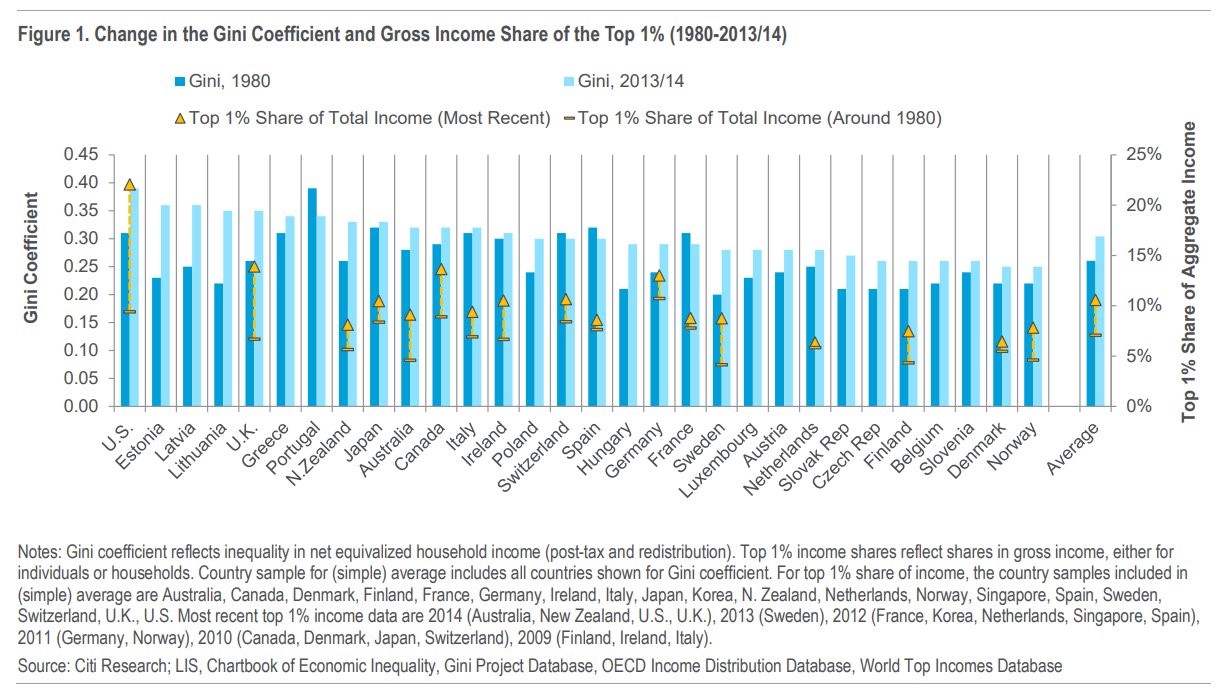
Changes In Inequality
The Gini coefficient is another inequality measurement. The US had a high increase in the top 1%’s control of the income. The US also had an increase in the Gini coefficient. The explanation we gave of the catalysts of inequality aims to give a framework for the discussion because many blame capitalism for inequality. The problem is prevailing corporatism and socialism, which is the cause of increasing inequality. If you are confused about this statement, ask yourself, are you better off if you have more choices or less.
Global Inventors
In the discussion about inequality we mentioned how the disastrous conditions in Venezuela are not the exclusion to the rule, but a prime portrayal of socialism progressing into communism, and how seemingly everyone arguing in favor of socialism overlooks the historic example of North Korea. Many socialists would call that a straw man argument claiming there are more successful socialist countries like Norway. However, this is where the definition of socialism gets cloudy because Norway is a mixed economy much like the US. The policies of each mixed economy are constantly changing, so it’s tough to label countries as leaning socialist or capitalist. It’s also worth noting, Norway also had an increase in inequality. As we mentioned, an expanding upper class isn’t the problem because more people being rich is great if they acquired the wealth through providing a great product or service. An increase in great businesses helps the poor as well, even if they don’t see an increase in wealth, because their spending power increases. Think about how the innovation in personal computing has allowed for proliferation of the internet, not to mention the countless other innovations and quality of life improvements. If you are still opposed to this idea, simply give up your access to the internet for a week or for five minutes, for that matter.
Innovation is the reason societies prosper. No one today prefers a horse and buggy over a car. The economies to witness the greatest innovation, despite the potential for displaced labor initially, witness greater prosperity and quality of life improvements. That’s why the chart below is so relevant to how well countries’ economies are doing. The chart measures the number of inventors per 1000 people in each country. In this category, the U.S. excels.
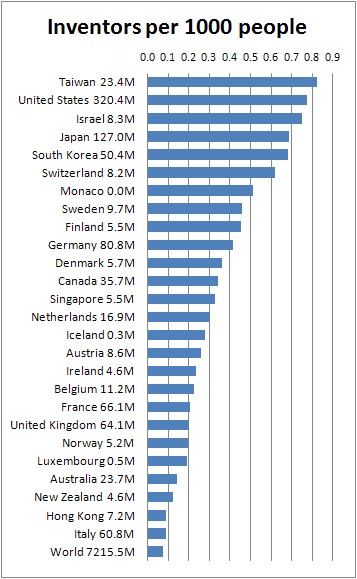
Inventors Per Capita
The state with the biggest impact on America’s number of inventors is California which represents 26% of the inventors. Since California has 12% of the population, the inventors are heavily concentrated in the state. Silicon Valley is like Hollywood for entrepreneurs. Business people and inventors from throughout the country and even the world visit to hear about new ideas. The culture and vibe are what makes it great. It’s tough for policymakers to create or destroy that type of atmosphere.
The number of inventors per country is a complex statistic because often inventions in one country permeate throughout the world quickly. For example, Google is even more dominant in Europe than it is in the US. The inventions in the US get exported globally. This is similar to the situation where inequality within the US increased, but compared to other countries it fell. This shows how economic trends always need to be contextualized on a global scale before policymakers act on rhetoric.
Innovation Leaders
Obviously, the inventors per capita is only one way to measure the inventiveness of a country let alone the trajectory of its economy. One of the most comprehensive lists on the inventiveness of economies is the GII (Global Innovation Index). It is comprised of the 5 input pillars that enable national economic innovation which are institutions, human capital and research, infrastructure, market sophistication, and business sophistication. It is also comprised of the two output pillars relating to innovation within the country which are knowledge and technology outputs and creative outputs. The final index looks at ratio of the outputs to the inputs to determine the innovation efficiency.
The chart below shows the top 10 countries in the GII.
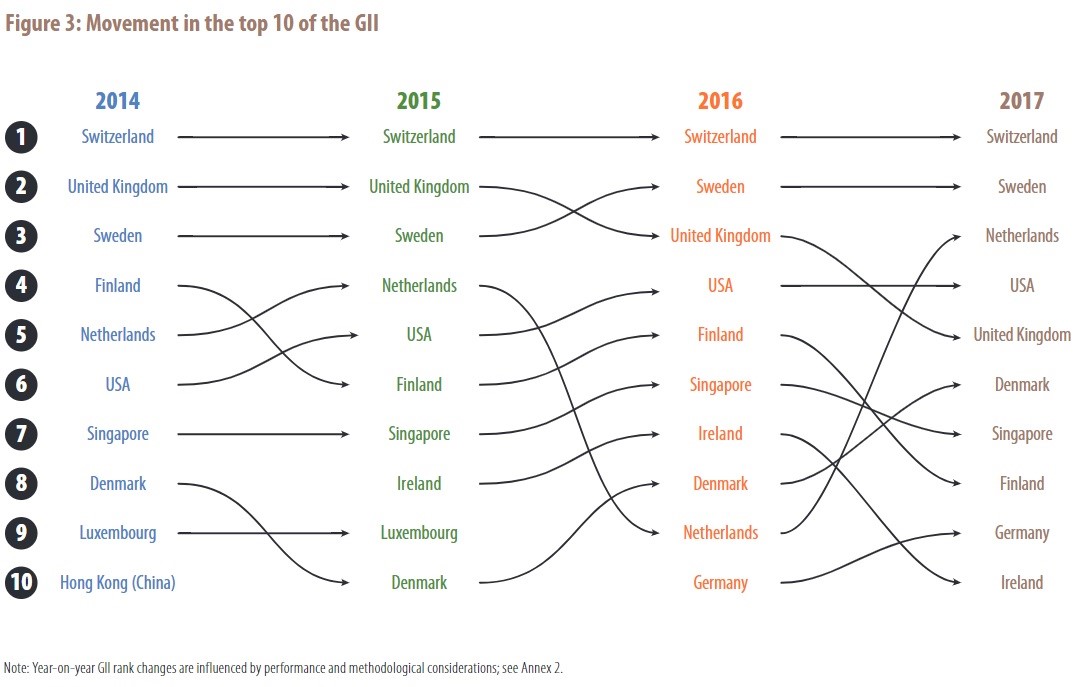
Past 4 Years Of The GII
The US has jumped from 6th in 2014 to 4th place in 2016 and remained there in 2017. Switzerland has stayed as the top country for the past 4 years. To be clear, if you’re comparing the inventiveness with the innovation index, remember that the invention chart uses 2014 information.
Millennials Are Not The Startup Generation
The final chart below shows the startup rate in the US by showing the percentage of firms which are less than 1 year old. This gives you a better long term picture of the inventiveness in the economy than the GII graphic.
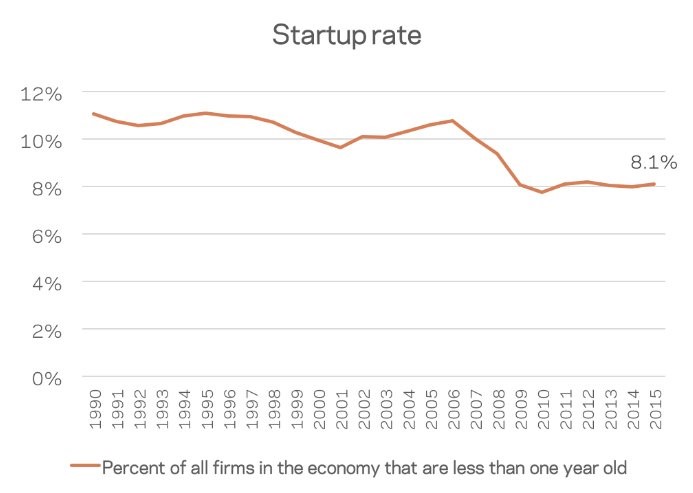
Millennials Aren’t The Startup Kings & Queens
This chart shows that the US saw less startups created in 2015 than in the 1990s. This might be because the top technology giants which are Google, Apple, Facebook, Amazon, and Microsoft are growing into monopolies. This chart puts the meme that millennials are the most entrepreneurial generation to bed. It’s not a stereotype suggesting that millennials are lazy, but has more to do with present day financial circumstances, whereby student loans are at record highs as is the cost of college. We detailed this in: Here’s Why Startups Are Dying.
Conclusion
Hopefully, this article helped you understand some of the global trends in inventiveness, innovation, and inequality. Remember to think about these global trends when analyzing the changes within countries. Deciding which change is caused by a new policy or global factors is challenging, but the fact that you’re even considering global trends shows you’re a step ahead of most policymakers. It’s also interesting to see how startups aren’t more prevalent now than in the 1990s given the size and number of unicorn valuations in Silicon Valley like Uber and Airbnb.
Sources
In most rich countries, income inequality has risen significantly since 1980 – #Citi pic.twitter.com/nTnZFrLZGm
— Rccrd (@Fmirw) October 19, 2017
What Are the Most Inventive Countries, States, and Cities?
https://www.globalinnovationindex.org
#Generation #Startup that aren't the #Millennials… despite all the ‘disruptors’ hype pic.twitter.com/vexpd9sTUc
— Constantin Gurdgiev (@GTCost) October 23, 2017
Have comments? Join the conversation on Twitter.
Disclaimer: The content on this site is for general informational and entertainment purposes only and should not be construed as financial advice. You agree that any decision you make will be based upon an independent investigation by a certified professional. Please read full disclaimer and privacy policy before reading any of our content.


