UPFINA's Mission: The pursuit of truth in finance and economics to form an unbiased view of current events in order to understand human action, its causes and effects. Read about us and our mission here.
Reading Time: 5 minutes
There is a prevailing belief that the Federal Reserve forecasts the economy accurately, which is why every word from Federal Reserve officials moves markets and is very critically examined. Previously we mentioned how some of the Federal Reserve assumptions about inflation and unemployment are inaccurate. It’s important to correct the inaccuracies now because the Fed looks as good as it will ever look as the labor market is the strongest it has been this cycle, as measured by the unemployment rate. Of course the participation rate lays out a completely different picture.
In the previous two bubble economies, when the economy looked the best and when optimism about the future was highest, this invariably led sooner or later to the opposite side of the spectrum, namely a complete removal of optimism. Good results don’t necessarily mean impending weakness, but when an economy is artificially propped up by debt, it does mean the probabilities of a recession occurring are much greater than if Americans were living with ample savings. Unfortunately that just is not the case. In addition, corporate debt is at its highest ever as we mentioned a few days ago.
The chart below shows how the U.S. non-financial market capitalization is above GDP for the third time in the past 60+ years. As mentioned previously, valuations are rising as companies continue to borrow funds to buyback their stocks, which leads to less shares available and higher stock prices. This is particularly beneficial to management holding stock options and as detailed earlier has not translated into nonsupervisory wage growth.
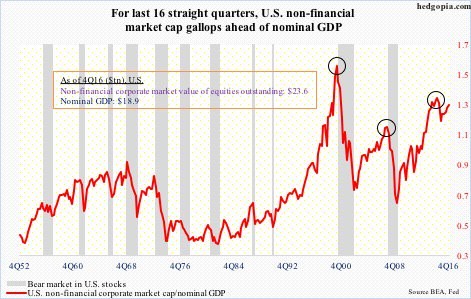
This is one example of how stocks are expensive. In the period of falling interest rates and rising debt, there have been three financial bubbles which are circled in the chart above.
The chart below shows the ten-year bond yield.
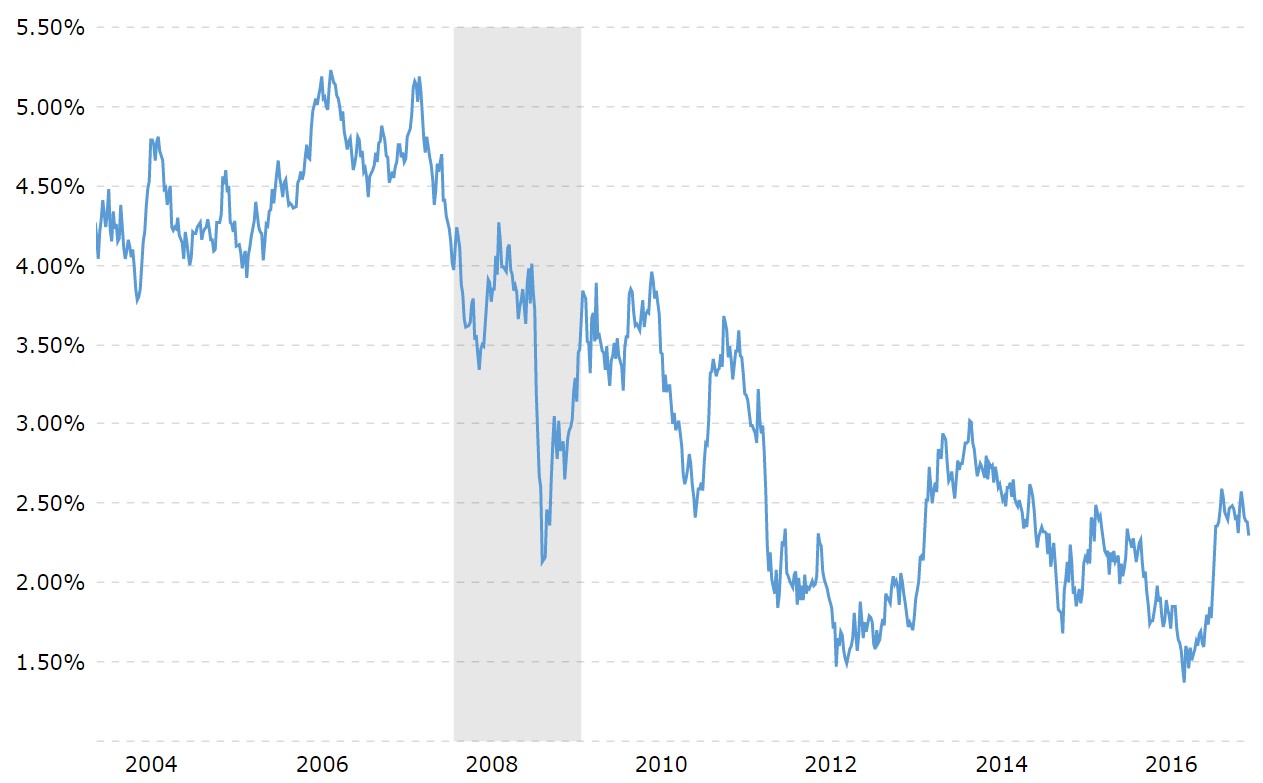
As you can see, the ten-year bond yield has fallen since the Fed’s quantitative easing program started in late-2008. While the Federal Reserve has created an artificial demand for debt, thereby driving the price of bonds higher and rates lower, the Federal Reserve, as much as it may like to think is not the sole variable in the pricing of bonds. In fact, it may be safe to say that the Federal Reserve does not lead policy decisions, it reacts to market action.
In the past five years investors have focused their attention on what is referred to as a “dot plot” chart. However, as it turns out, the dot plot, which is a collective demonstration of what Fed officials think of the future, has turned out to be not so credible as some market participants explained it.
Here is an example of a dot plot chart:
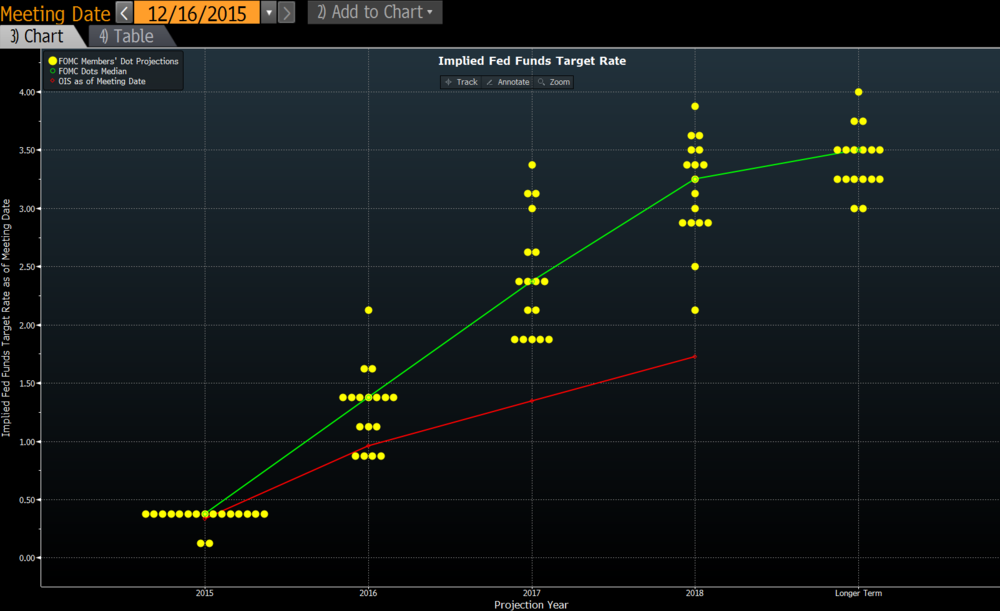
Each dot represents what a member of the Fed thinks about the future. The Fed Funds rate today is 0.75%, not 2.00% nor 2.50% as Fed officials expressed would be the case two years ago. In other words, the forecast is incorrect by 62%.
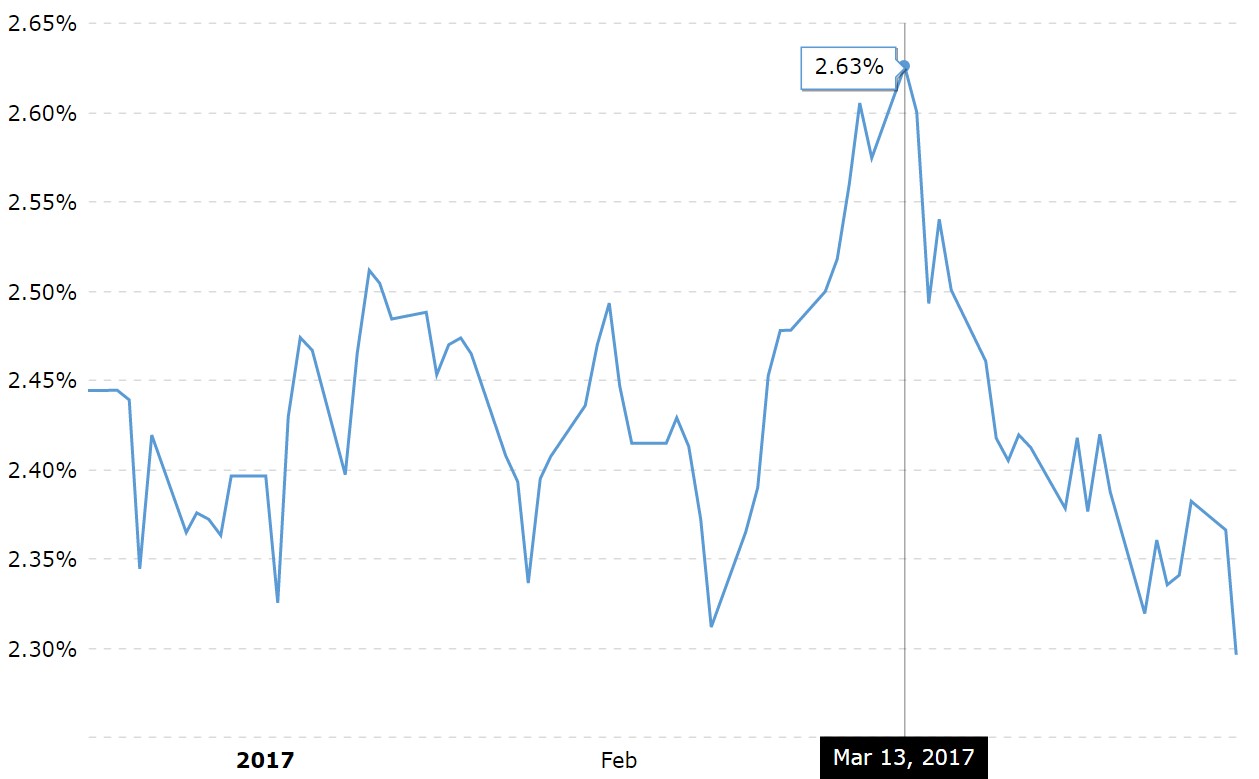
If you were to listen to the Fed, you’d think it was having great success from its policies, but currently it’s having its worst run ever and it’s in plain sight if you understand where to look. The Fed is providing guidance that it plans to raise interest rates three times or 75 basis points in 2017. It also plans to start unwinding the balance sheet in a gradual manner starting in the fourth quarter, and even that may not happen. What’s interesting is that when the Federal Reserve started talking about unwinding the balance sheet, the ten-year bond yield started to fall, and bond prices increased. It defied the Fed’s policy proposal as you’d think an increase in the supply of bonds would cause them to sell off and yields to rise.
This defiance of the Fed’s unwind policy and the Fed’s expectation for rising interest rates, doesn’t mean the market is ignoring the Fed. It can make sense to buy bonds in this scenario because the ten-year bond is commonly regarded as a safe-haven trade, something we dispute here.
The Fed unwinding the balance sheet is an uncertain event as nothing of this magnitude has been done before. This causes a ‘risk off’ trade to garner more attention over the ‘risk on’ trade, since bonds are in theory less risky than stocks. However, whats interesting is that stocks have continued to rise alongside bonds. This can only mean one thing – one of these instruments is wrong.
Besides the emergence of investors worried about the uncertainty provided by monetary policy, the other motivation for investors seeking the “safe haven” investment is the perceived safety of government bonds with the prospects of a worsening economy. In fact, this logic is inaccurate. When the economy contracts, government revenues fall, which actually increases the risks of owning government debt. In other words, in the long-term, the risks of bond rates increasing are far higher than rates decreasing. In the short-term however, the customary “risk-off” investment continues to be government bonds until it is realized that the problem is the government debt itself.
Stock investors have been bullish because of the perceived hope of fiscal stimulus provided by the Trump administration, which we may add is quickly waning. With the GOP’s healthcare plan failing, this delays tax reform and fiscal policy, delaying any potential rescue for a slowing economy. In fact the economy needs more rescuing than previously expected by the Federal Reserve as the GDP growth forecasts for Q1 have fallen.
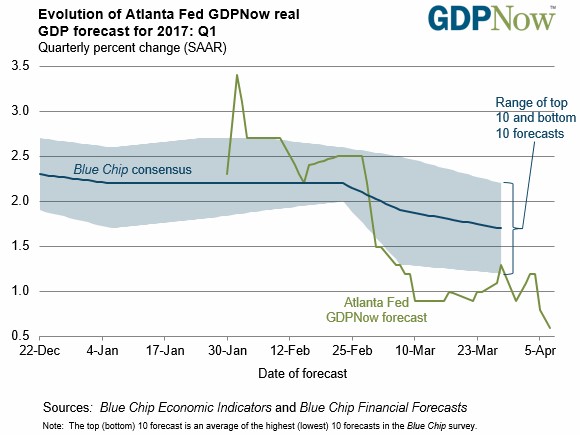
As you can see in the chart below, the blue-chip consensus has fallen to expecting 1.7% growth and the Fed’s GDP Now forecast is expecting 0.6% growth. The rally in the long bond supports the narrative that growth is weak.
Conclusion
Lowering interest rates has boosted stock multiples, but the Federal Reserves latest action to raise rates and unwind the balance sheet are proving that it’s not responsible for the decline in yields. An analogy for this scenario is a man getting behind a car and pushing. The car starts moving after the man pushes. The man thinks he caused the car to move. However, after he lets go, the car accelerates forward. He realizes someone was driving the whole time he was pushing. The Fed thinks it’s responsible for the declining yields in long bonds because of its dovish policy (more stimulus). However, after switching to being hawkish (less stimulus), yields have dropped, proving this assumption incorrect. Finally, it’s worth noting that the economy may see below 1% GDP growth in Q1 which goes against the notion that the economy is reaching the Fed’s goals.
Have comments? Join the conversation on Twitter.
Disclaimer: The content on this site is for general informational and entertainment purposes only and should not be construed as financial advice. You agree that any decision you make will be based upon an independent investigation by a certified professional. Please read full disclaimer and privacy policy before reading any of our content.


