UPFINA's Mission: The pursuit of truth in finance and economics to form an unbiased view of current events in order to understand human action, its causes and effects. Read about us and our mission here.
Reading Time: 5 minutes
The April durable goods orders report was weak. Now the list of bad reports includes this one, the April retail sales report, the April industrial production report, and the May Markit Flash PMI. We are seeing the likelihood of below 2% Q2 GDP growth increase quickly. Most of the positive economic results are coming from housing, while the manufacturing sector is heading towards a recession. Q2 GDP will likely be an ‘emperor has no clothes’ moment as Q1 GDP growth was inflated by inventory investment and trade as we pointed out in “Everything Wrong With Q1 2019 GDP Report”.
Headline monthly new orders growth was -2.1% which beat estimates for a 2.2% decline. However, it’s still weak because March new orders growth was revised from 2.7% to 1.7%. If you’re looking at monthly growth, then the previous month’s revision affects the latest month’s growth since it is the comparison. A slight beat combined with a terrible revision isn’t good news. The saving grace here is aircraft orders pulled down growth as they fell 39% monthly. We care more about core orders because aircraft orders are very volatile. That 39% decline wasn’t as bad as some feared. Aircraft orders growth was expected to be weak because of cancelations for Boeing’s 737 plane due to its crash.
Unfortunately, the details of this report are also weak. The bad headline number tells the truth. Ex-transportation monthly orders growth was 0% which again beat the consensus by one tenth. Again, the March results were revised down, this time from 0.4% to -0.5%. The all-important core capital goods orders reading was terrible which is why this report wasn’t good. Monthly growth of -0.9% missed estimates for 0.1% growth. Furthermore, March’s growth rate was revised down from 1.3% to 0.3%.
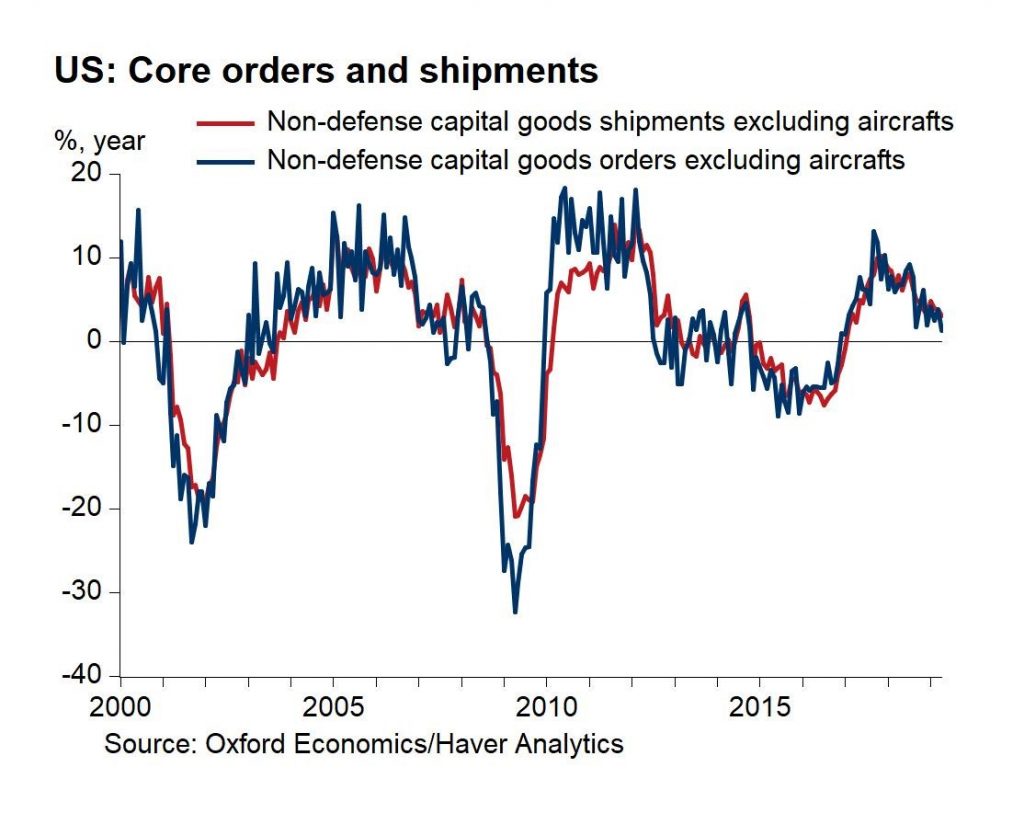
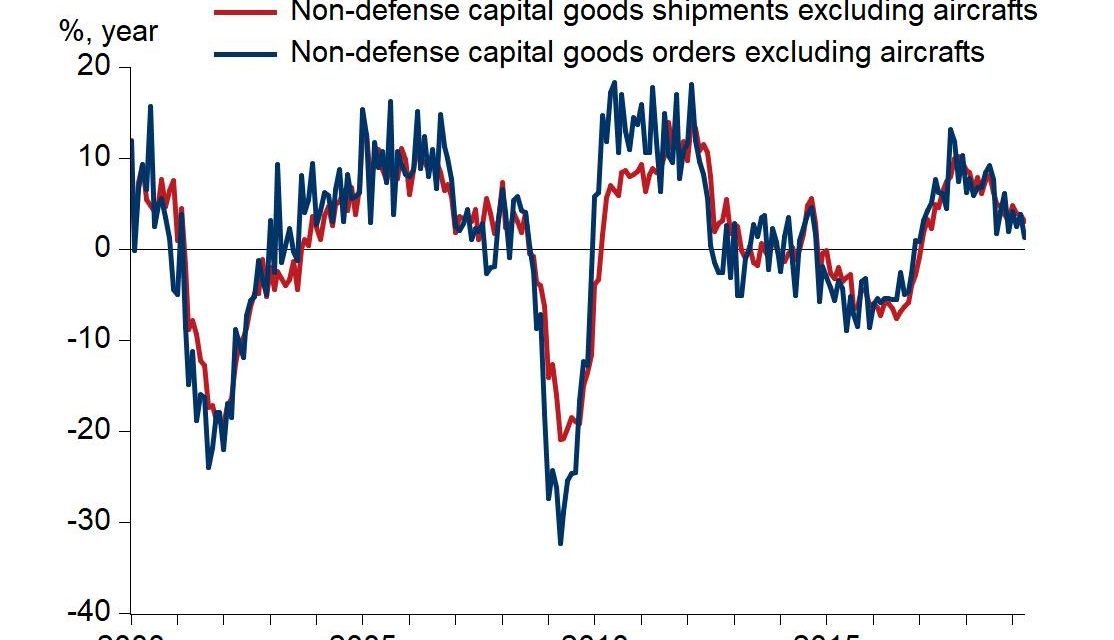
As you can see from the chart above, non-defense capital goods orders excluding aircrafts were up 1.3% yearly. Core shipments were up 3%. Core orders growth was the weakest since January 2017 which was the beginning of the current cyclical upswing which is now ending. The worst reading in the 2015-2016 manufacturing recession was in June 2015 when yearly growth was -8.9%. This April durable goods orders report isn’t as bad as the flash May Markit PMI which had manufacturing at a 116 month low. The economy might have gotten worse in May from April. Also, firms were probably spooked by the latest round of tariffs which Trump announced on May 10th. The Chinese retaliation followed soon afterwards.
Orders for new vehicles fell 3.4% monthly which supports the weakness in auto sales and the spike in auto loan delinquencies. While we have seen some encouraging signs from the housing market, the auto industry isn’t doing as well. Primary metals orders fell 0.8% in April and 1.9% in March. Fabrications orders were up 0.4% after falling 1.6% and 2.1%. Machinery orders were up 0.1% after a 2% decline. Finally, unfilled civilian aircraft orders fell 0.3% after falling 0.1% and 0.5%.
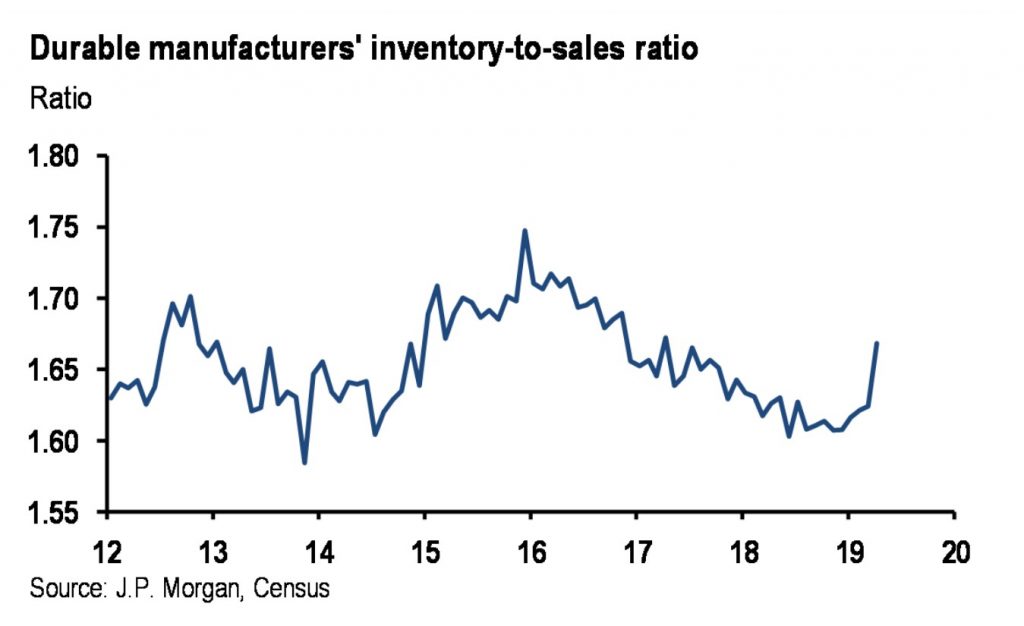
As you can see from the chart below, the durable manufacturers’ inventory to sales ratio has been increasing because of decreased demand growth. The spike decreases the likelihood that inventory investment will boost GDP growth in Q2 like it did in Q1. It wouldn’t make any sense for firms to boost inventories after they just did especially since economic growth is weakening.
GDP Estimates
Following April and May economic reports, estimates for Q2 GDP growth have quickly fallen because of the list of weak economic reports we mentioned at the start of this article. The median estimate for Q2 GDP growth is only 1.8%. JP Morgan lowered its estimate from 2.25% to 1% because of the durable goods orders report and the retail sales report. Goldman Sachs lowered its tracking estimate from 1.5% to 1.3%. It also lowered its estimate for Q1 growth from 3.1% to 3%. The initial reading was 3.2%. The first revision will come out on May 30th.
Now let’s look at the regional Fed Nowcasts. The St. Louis Fed is usually optimistic, the NY Fed is usually pessimistic, and the Atlanta Fed’s reading is all over the place. The St. Louis Fed stayed true to its history as its estimate is 2.8%. That’s the only estimate we’ve seen above 2.0%. The Atlanta Fed Nowcast is at 1.3% as it was revised up from 1.2% because of the new home sales report which pushed the estimate for real domestic investment growth from -4% to -1.6%. As you can see from the chart below, it’s on the low end of its range since 2011. It hasn’t been negative in the past 8 years.
A negative reading at any point in a quarter would be notable. The later in the quarter, the more accurate Nowcasts become because they include more economic reports.
Finally, the NY Fed’s Nowcast was also true to its history as it was revised down from 1.79% to 1.41% which is its 2nd lowest estimate since it started tracking Q2 growth on March 1st. The Nowcast fell because of the durable goods report, new home sales report, and data revisions.
String Of Missed Estimates
As you can see from the chart below, the global economic surprise index has been negative for 290 days which is the longest streak since at least 2003.
It’s clear by looking at this chart that the surprise index is very volatile. Take this index with a grain of salt since just because an economic report beats estimates, doesn’t mean it was good or showed sequential improvement and vice versa. Even so, it’s interesting to see that economists haven’t properly lowered their economic forecasts in almost a year. This highlights how 2018 was a disappointing year for the global economy even though it was great for America. Note how the index isn’t nearly as negative as it was during the financial crisis of 2007-2009. This a relatively mild protracted slowdown.
Where Are The Rate Cuts?
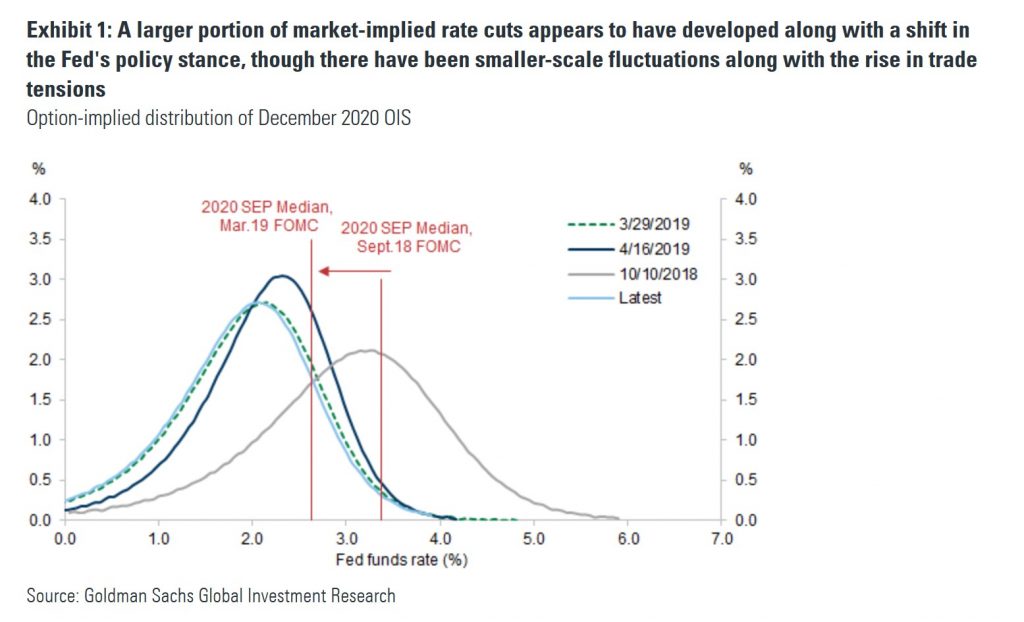
The June 19th Fed meeting is shaping up to be the most critical Fed meeting since last December because the economy is weakening, but the Fed hasn’t agreed with the futures market that there will be at least one cut this year. You can see in the chart below the market expects lower rates by December 2020 than the Fed’s guidance. The Fed probably won’t cut rates in June as even the market only sees a 6.7% chance of that occurring. However, guidance will be critical. You would think the disappointing Markit PMI and durable goods orders report would be enough to push the Fed dovish.
Conclusion
Core durable goods orders growth missed estimates and yearly growth was the lowest since January 2017. Growth is still positive, but it is heading in the wrong direction. Almost all GDP growth estimates have Q2 growth at or below 2%. Q2 will have similar fundamentals to Q1 without the boost from inventories and trade. The global surprise index has been negative for 270 days. It’s time for economists to realize this is a protracted cyclical slowdown. It’s also time for the Fed to realize the U.S. economy is in its 3rd slowdown of this expansion. If the Fed doesn’t react properly, the risks of a recession occurring could increase.
Have comments? Join the conversation on Twitter.
Disclaimer: The content on this site is for general informational and entertainment purposes only and should not be construed as financial advice. You agree that any decision you make will be based upon an independent investigation by a certified professional. Please read full disclaimer and privacy policy before reading any of our content.


