UPFINA's Mission: The pursuit of truth in finance and economics to form an unbiased view of current events in order to understand human action, its causes and effects. Read about us and our mission here.
Reading Time: 4 minutes
The two most prominent weak economic reports in Q2 have been the April retail sales and industrial production reports. We’ve explained in previous articles why they could be one-off reports. The latest round of tariffs hasn’t had a chance to affect the monthly economic reports because they were announced so recently.
Very Terrible Markit PMI
The May Flash Markit PMI reading was terrible as it is consistent with just 1.2% GDP growth. That’s similar to the Atlanta Fed’s 1.3% GDP growth estimate which is relatively low. The consensus is 1.8% Q2 growth. Neither of those data points fully grasp how bad this report was. The best way to understand that is to compare it to its recent results. The composite output index fell from 53 to 50.9 which was the worst reading in 3 years. Keep in mind, the flash reading is from the first 2 weeks of the month which means the final monthly reading will probably be a bit different because it includes the 2nd half of the month. Since the survey was done when the tariffs were announced, they likely played a role in this decline in sentiment. Business confidence fell to its lowest level since at least 2012.
The flash reading makes the April Chicago Fed national activity index look good and that showed below trend growth. As you can see from the chart below, the services business activity PMI fell from 53 to 50.9 which was the lowest reading in 39 months. We already know the manufacturing sector is much weaker than last year. If the services sector follows suite, this will be a deep slowdown. The rate of growth in new orders fell for the 3rd straight month. The level of outstanding business fell for the first time this year and employment growth fell to a 25 month low. Output prices fell for the first time since February 2016. It’s clear inflation is falling, with the only mitigating factor being tariffs.
The manufacturing sector PMI fell from 52.6 to 50.6 which was a 116 month low. The PMI was relatively solid last month compared to other manufacturing reports, but this reading was downright terrible as it is below any point during the 2015-2016 manufacturing recession. It’s one of the few reports we’ve seen show that this slowdown is the worst since the start of the expansion. If future reports such as the ISM PMI come out in line with this Markit report, there will be increased calls for a recession this year.
As you can see from the chart below, new orders fell for the first time since August 2009 when the economy was just exiting the last recession. Weak new order demand was catalyzed by weak conditions and the hesitancy to place orders possibly because firms were uncertain about the trade war.
Solid New Home Sales Report
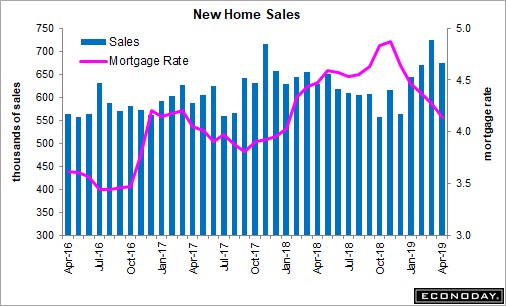
With the 30 year fixed mortgage rate cratering, it’s no surprise the housing market is starting to rebound in the all-important spring selling season. You can see sales increasing as interest rates fall in the chart below. As of May 23rd, the 30 year mortgage rate was 4.06% which is tied for the lowest reading of the year. It’s weird to think of the Chinese trade war helping anyone, but if it is leading to the rally in treasuries, it’s helping homes become more affordable.
The March revision pushed sales from 692,000 to 723,000 which was a new cycle high. The median cyclical peak before recessions is 28 months. That’s what makes the new cycle high important as the previous high was 17 months ago. The indicator went from predicting a recession in 11 months, to resetting and predicting one in 27 months.
The April reading missed estimates slightly as it came in at 673,000 which was below the consensus for 680,000. The February reading was also revised up 8,000, so you can’t say this was a bad report even though the latest month of data missed estimates. The 3 month average was up 2.4% sequentially which was better than the 1.7% 3 month average growth in existing home sales.
April price growth was 11.9% monthly which brought prices to $342,200. Yearly median price growth was 8.9% which is slightly above the yearly sales growth of 7%. Because sales were so strong, supply fell 0.9% to 332,000 units. As you can see from the middle left chart below, supply relative to sales increased from 5.6 months to 5.9 months.
Earnings Estimates Look Bad Again
Q1 earnings estimates cratered in the first 2 months of the year which was odd because stocks rallied so sharply. That’s was an unusual situation where stocks had fallen sharply in the prior few months, the Fed turned dovish, and the market got optimistic on trade. Q2 estimates fell less than average in April which supported the rally in stocks. Lately the increased decline in estimates supports the decline in stocks in May.
As you can see from the table below, from March 1st to May 1st Q2 earnings growth estimates only fell from 2.32% to 1.47%. That’s a decline of 0.85%.
However, in the first 23 days of May, EPS estimates fell from expecting 1.47% growth to 0.1% growth. That’s a decline of 1.37%, meaning the decline was larger in less than half the time. 3 months ago, Q1 estimates expected higher growth than Q2 estimates currently do. That implies growth will probably fall from Q1. It will probably end up below 4.68%.
Conclusion
The Markit PMI flash reading implies rising risks of a recession occurring as early as this year. The biggest hope for the bulls is the trade war gets sorted out and boosts business sentiment. The new home sales report was fantastic because of the 39,000 in upward revisions from the prior 2 months. The new cycle high implies there won’t be a recession for at least another 27 months. That can be taken away if March’s reading is revised lower in the May report. Earnings estimates have cratered in May, supporting the S&P 500’s 4.07% decline month to date.
Have comments? Join the conversation on Twitter.
Disclaimer: The content on this site is for general informational and entertainment purposes only and should not be construed as financial advice. You agree that any decision you make will be based upon an independent investigation by a certified professional. Please read full disclaimer and privacy policy before reading any of our content.


