UPFINA's Mission: The pursuit of truth in finance and economics to form an unbiased view of current events in order to understand human action, its causes and effects. Read about us and our mission here.
Reading Time: 5 minutes
The Q1 GDP report was controversial because of the effects of inventory, trade, and the price index, which is otherwise known as the deflator. Bearish investors were extremely offended by this report because the stock market is at its all-time high and the headline quarterly growth of 3.2%, which beat estimates for 2.3%, made the economy look stronger than the underlying numbers indicate. There’s no need to get emotional about this report as initial estimates are subject to revisions.
We’ve already mentioned in previous articles how it’s problematic to rely too heavily on this report. As a reminder for how estimates can swing wildly, it wasn’t until 2010 that GDP estimates realized that 2008 GDP was in a contraction, 2 years later – as we discussed in this article. We are stating this, not to imply that it will be as bad again now, but that GDP estimates are process that continues after the first GDP report comes out. It’s simply an estimate of what growth might have been in Q1. Whether or not it’s accurate doesn’t take away from the amazing stock market rally this year. This report probably won’t affect monetary policy as the Fed won’t suddenly hike rates on a strong headline beat. Low inflation won’t make the Fed cut rates either as the labor market is strong. This GDP report shouldn’t completely change your viewpoint on the economy. The economy has been in a modest slowdown and continues to be in one after this report was released. Politicians love to cite GDP when determining the success of the economy, but headline growth is only a messy summary of the changes to the economy.
Great Headline Reading
Almost every GDP report has details which differ from the headline reading. That is the nature of this all-encompassing report. We’ve seen a few weak first quarter GDP reports this cycle. That caused the seasonal adjustment to be updated. Q1 2019 had the fastest first quarter GDP growth since Q1 2015. GDP growth has been above 2% for 8 straight quarters. That’s the longest streak since 2005.
On a yearly basis, this GDP report was fantastic as growth was 3.2% which was the highest rate in 4 years. Last quarter, many of the bears and some of the bulls predicted yearly growth would peak in Q4. Sometimes even confident predictions made by the majority can be way off.
This headline reading signals no economic slowdown, but final sales signal otherwise. Final sales exclude the effect of net exports and private inventories. As you can see from the chart below, final sales to domestic purchasers’ growth fell to 1.52%. This was a huge divergence from real GDP growth. It was the lowest growth rate in 6 years, meaning this report supports the thesis that there is an economic slowdown. Growth was about 0.8% below this expansion’s average. Real GDP growth was about 0.9% above average.
Low Inflation Reading Helps Real Growth
Let’s look at the details of this report now. The core price index was up 1.3% which missed estimates for 1.6%. The overall price index was up 0.9% instead of 1.7%. When the deflator falls, real growth rises (all else being equal). As you can see from the chart below, even though nominal growth fell, real growth rose because inflation fell.
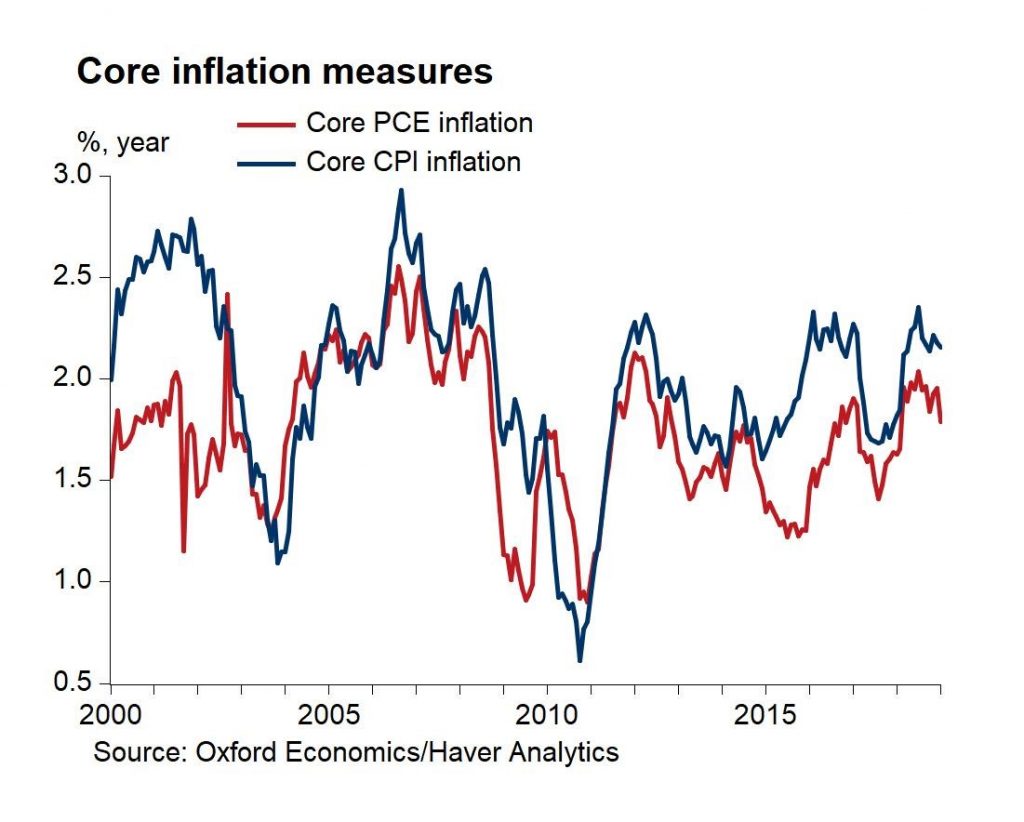
Q1 headline PCE inflation was 1.4% yearly and core PCE inflation was 1.7%. The chart below shows the decline in core PCE inflation was worse than the decline in core CPI.
If you’re wondering why the Atlanta Fed’s projection for 2.7% growth was wrong, it came down to trade. Net exports of goods and services helped GDP by 1.03 points. The Atlanta Fed model had it helping growth by 0.45 points. Exports helped by 0.45 points and imports helped 0.58 points which was the most in 6 years. If the consumer is weak and imports drop, it helps GDP, but it doesn’t mean the economy is very strong.
Weak Consumer Spending And Residential Investment
This brings us to real consumer spending growth which was weak. Growth fell from 2.5% to 1.2% which beat estimates for 1.1%. It helped GDP by 0.82 points. Spending on durables hurt GDP growth by 0.38 points. That’s interesting because the March durable goods orders report showed motor vehicle orders were up 2.1% monthly. Maybe firms see demand increasing. Non-durables and services added 0.24 and 0.96 to GDP growth.
As you can see from the chart below, residential investment’s contribution to real GDP growth was -0.11 as spending fell at a 2.8% annual pace.
This contraction was supported by the weak March housing starts report. We expect the housing market to improve in the next few quarters as real wage growth is strong and mortgage rates have fallen. On the negative side, according to the Housing Market Index, traffic to open houses fell in April, so this slowdown will be tough to overcome.
Strong Defense Spending
Government spending growth was 2.4% which helped GDP growth by 0.41 points. This was all about defense spending. Quarterly defense spending growth was 4.1%, while non-defense spending growth was -5.9%. Defense spending growth has been strong since President Trump was elected. As you can see from the chart below, this was one of the lowest non-defense spending growth readings of this expansion.
Inventories Drove Growth
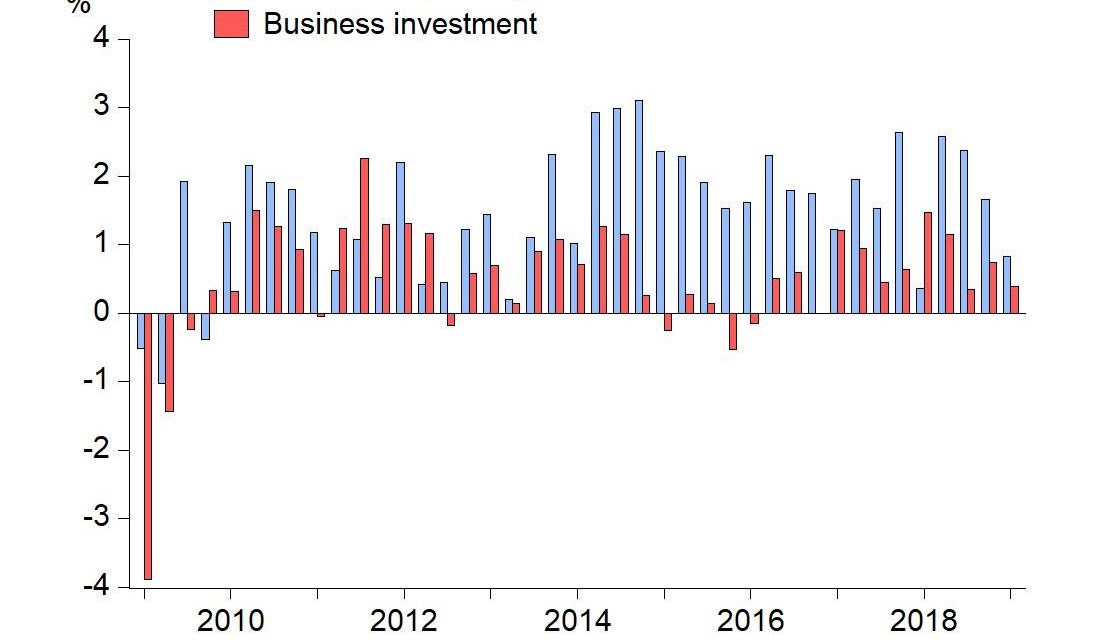
In the short run, inventories can wreak havoc on GDP growth. Investors try to ignore inventories because in the long run they have no effect on GDP. In Q1 the change in private inventories helped GDP growth by 0.65 points. The chart below highlights how weak this GDP report was.
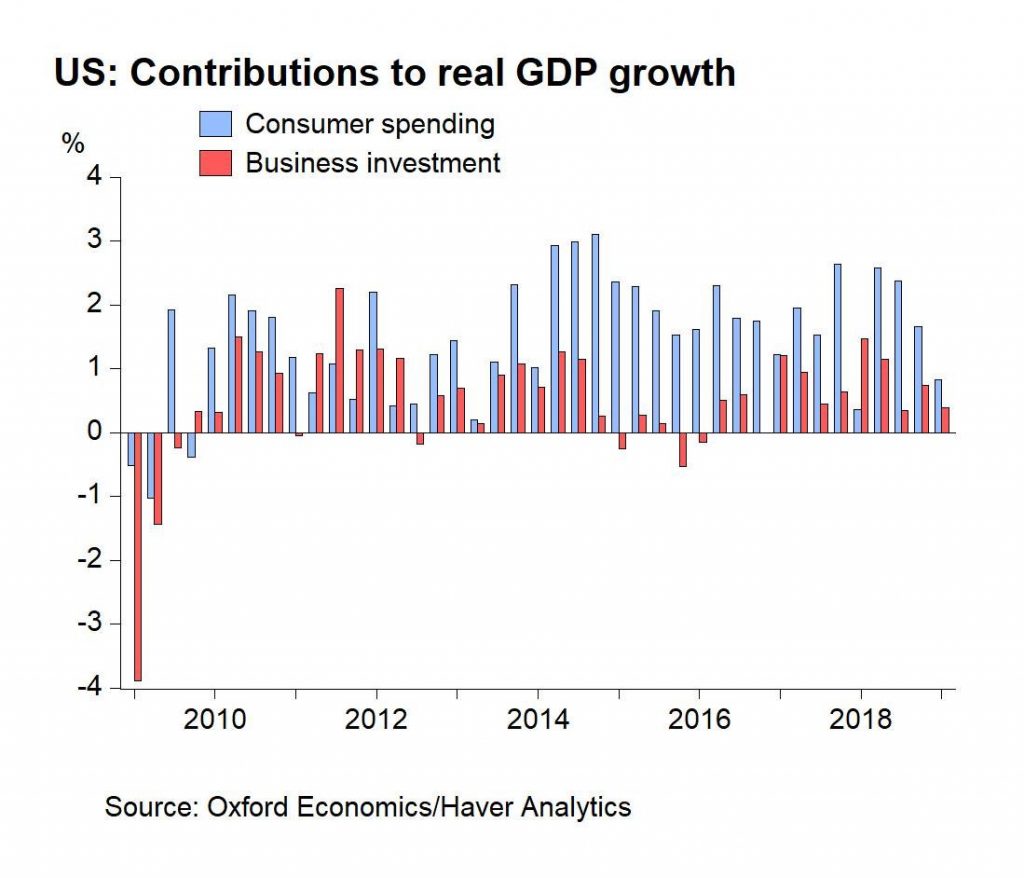
Consumer spending’s contribution to GDP growth has fallen 3 straight quarters and business investment’s contribution wasn’t strong either. Business investment growth was 2.7% which added 0.38 points to GDP. Gross private domestic investment added 0.92 points to GDP growth.
Good News On Productivity
The chart below shows this report in a good light because GDP growth was driven by productivity growth.
As you can see, productivity’s quarterly annualized growth of 2% was double the average growth in 2006 and 2007. Weekly hours worked wasn’t a factor which is good news because growing hours worked isn’t sustainable. Population growth slowed. Population growth is a long run factor that has little to do with short economic cycles. The employment to population ratio improved slightly as more people are working in this tight labor market.
Conclusion
The headline GDP growth reading masks some weakness as the consumer didn’t have a great quarter. Inventory, trade, and low inflation all boosted this report. However, you shouldn’t rely on the initial GDP report to be your only source of economic research. These numbers will all be changed in the revision on May 30th. Stocks are reacting to earnings guidance, not this GDP report.
Have comments? Join the conversation on Twitter.
Disclaimer: The content on this site is for general informational and entertainment purposes only and should not be construed as financial advice. You agree that any decision you make will be based upon an independent investigation by a certified professional. Please read full disclaimer and privacy policy before reading any of our content.


